


 | ||
| 25th March 2026 | view in browser | ||
| Dollar firm as oil keeps risk alive | ||
| The dollar remains supported by elevated oil prices and geopolitical risks around Hormuz, as markets weigh fragile diplomatic optimism against persistent inflation and growth concerns, with price action suggesting underlying risks are still firmly in play. | ||
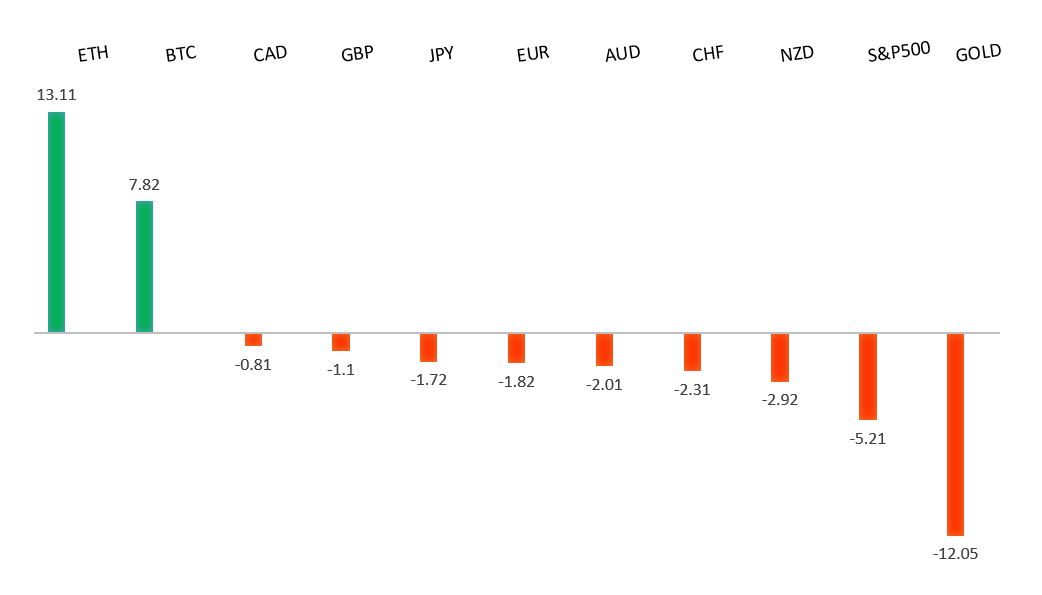
| Performance chart 30day v. USD (%) | ||
 | ||
| Technical & fundamental highlights | ||
| EURUSD: technical overview | ||
| The Euro outlook remains constructive with higher lows sought out on dips in favor of the next major upside extension targeting the 2021 high at 1.2350. Setbacks should be exceptionally well supported ahead of 1.1300. | ||
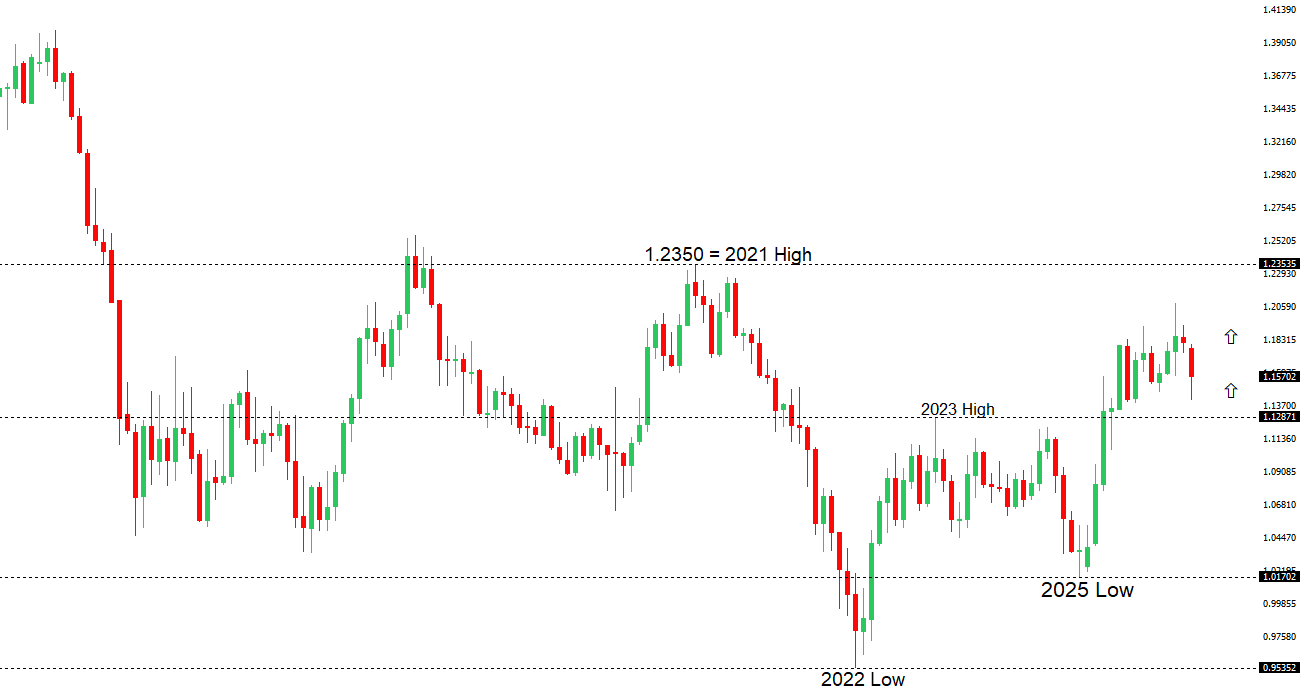 | ||
| R2 1.1668 - 10 March high - Strong R1 1.1641 - 23 March high - Medium S1 1.1411 - 13 March/2026 low - Medium S2 1.1400 - Figure - Strong | ||
| EURUSD: fundamental overview | ||
| Euro bulls are trying to get some momentum going, but gains remain limited for now. The macro backdrop points to a stagflationary mix in the euro area, with slowing growth, weakening demand, and rising energy prices, while the ECB is becoming more focused on inflation and keeping the door open to further rate hikes. Although markets are pricing in additional tightening, many strategists doubt it will offset the drag from the energy shock, leaving the euro vulnerable in the near term—though longer term, positioning and diversification away from the USD could offer some support. | ||
| USDJPY: technical overview | ||
| There are signs of the formation of a meaningful top after the market put in a multi-year high in 2024. At this point, rallies should be well capped above 160.00 in favor of a fresh down-leg back towards the 2024 low at 139.58. Only a monthly close above 160.00 negates. | ||
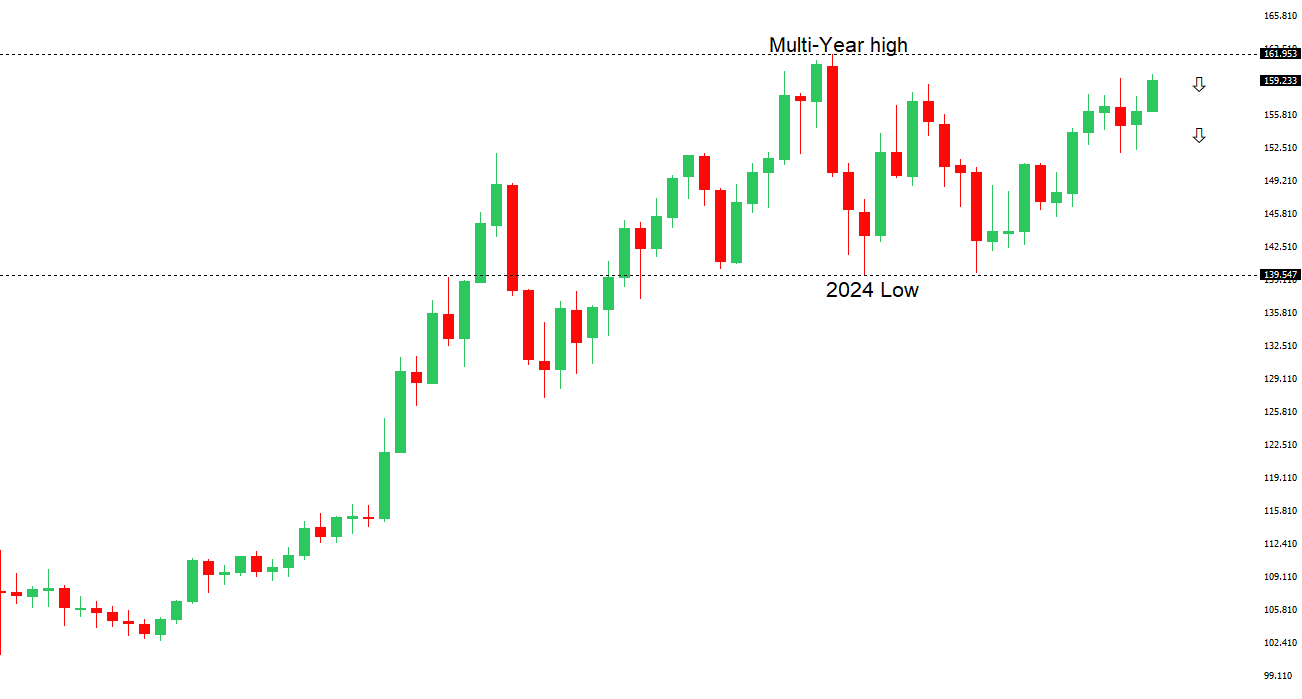 | ||
| R2 160.00 - Psychological - Strong R1 159.91 - 18 March/2026 high - Medium S1 157.27 - 10 March low - Medium S2 156.45 - 5 March low - Strong | ||
| USDJPY: fundamental overview | ||
| The yen remains under pressure, trading near multi-decade lows as softer headline inflation is offset by still-elevated underlying price pressures and strong wage growth, keeping the Bank of Japan on a gradual tightening path with a possible April hike still in play. Recent data point to an economy that is expanding but losing momentum, alongside only modest consumption, reinforcing a cautious normalization outlook. While structural forces like outbound investment and carry flows continue to weigh on the yen, rising intervention risks near the 160 level and building tightening expectations leave it vulnerable to periods of sharp rebound amid ongoing volatility. | ||
| AUDUSD: technical overview | ||
| There are signs of the formation of a longer-term base with the market recovering out from a meaningful longer-term support zone. The latest monthly close back above 0.7000 takes the big picture pressure off the downside and strengthens the case for a bottom, with the focus now on a push towards 0.8000. Setbacks should now be well supported ahead of 0.6700. | ||
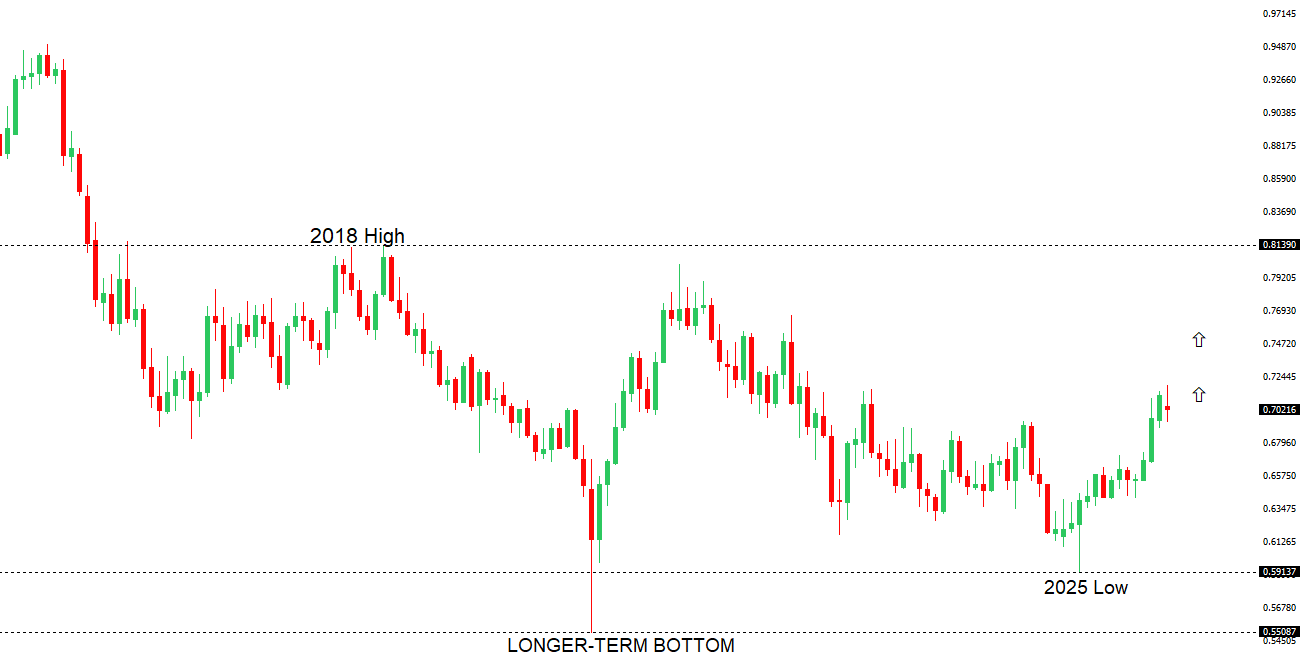 | ||
| R2 0.7200 - Figure - Medium R1 0.7188 - 11 March/2026 high - Medium S1 0.6910 - 23 March low - Medium S2 0.6897 - 6 February low - Strong | ||
| AUDUSD: fundamental overview | ||
| The Australian dollar has come under some pressure in recent sessions. The latest weakness reflects risk aversion driven by renewed geopolitical tensions, while attention turns to Australia’s February CPI, expected to remain elevated and potentially rise further due to energy price pressures—complicating the RBA’s policy outlook. In the short term, AUD may remain volatile, but dips could attract buyers given support from yields and commodities. Markets continue to price in additional RBA rate hikes, supporting a more constructive medium-term outlook. | ||
| Suggested reading | ||
| Asking Questions Crucial As Emotions Surge, J. Calhoun, Alhambra Investments (March 22, 2026) He Predicted War’s Start on Polymarket, Now Its End, G. Gottsegen, Marketwatch (March 23, 2026) | ||