


 | ||
| 15th May 2025 | view in browser | ||
| Dollar wobbles as CPI softens and Fed eyes dovish tilt | ||
| Softer-than-expected US CPI data and expectations of converging economic growth and lower interest rates continue to hinder the dollar’s recovery. | ||
| Performance chart 30day v. USD (%) | ||
 | ||
| Technical & fundamental highlights | ||
| EURUSD: technical overview | ||
| The Euro has finally broken out from a multi-month consolidation off a critical longer-term low. This latest push through the 2023 high lends further support to the case for a meaningful bottom, setting the stage for a bullish structural shift and the next major upside extension targeting the 2021 high at 1.2350. Setbacks should be exceptionally well supported below 1.1000. | ||
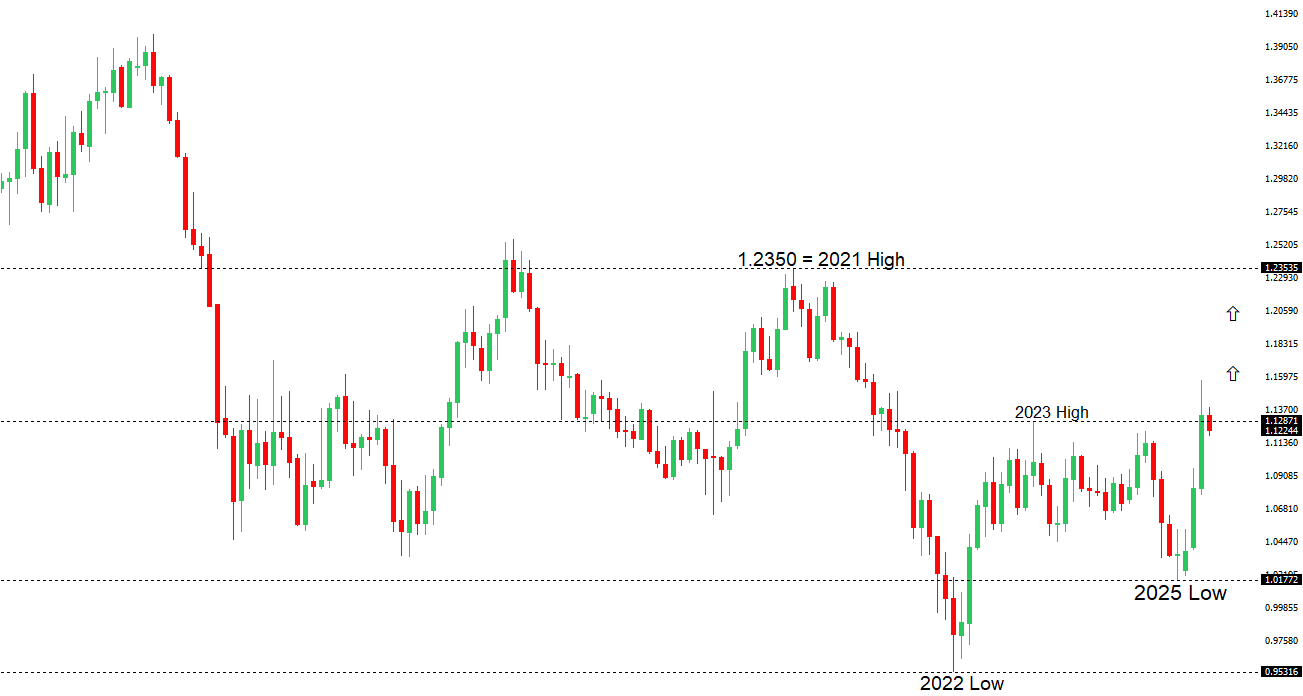 | ||
| R1 1.1293 - 9 May high - Medium R1 1.1243 - 12 May high - Medium S1 1.1065 - 12 May low - Medium S2 1.1000 - Psychological - Strong | ||
| EURUSD: fundamental overview | ||
| Recent softer-than-expected US CPI data has fueled speculation the Federal Reserve may adopt a more dovish stance, potentially weakening the dollar. Discussions between US and South Korean officials on exchange rate policies, alongside Japan’s finance minister’s comments on currency matters, have heightened market suspicions the Trump administration may favor a weaker dollar to facilitate trade deals, despite assurances from Treasury Secretary Bessent of a strong dollar policy. This perception, reinforced by earlier Asian currency strength in May, could prompt Asian nations with substantial dollar reserves—estimated at $2.5 trillion by Eurizon SLJ Capital’s Stephen Jen—to unwind positions or hedge, boosting demand for the euro, yen, and gold. Meanwhile, ECB supervisors are urging European banks to prepare for potential US dollar shortages under a less cooperative Trump administration, while German Chancellor Merz announced plans to boost defense spending to over €60 billion annually, aiming to transform Germany’s military into Europe’s strongest to counter Russian threats and support Ukraine. | ||
| USDJPY: technical overview | ||
| There are signs of a meaningful top in place after the market put in a multi-year high in 2024. At this point, the door is now open for a deeper setback below the 2024 low at 139.58 over the coming sessions exposing a retest of the 2023 low. Rallies should be well capped below 150.00. | ||
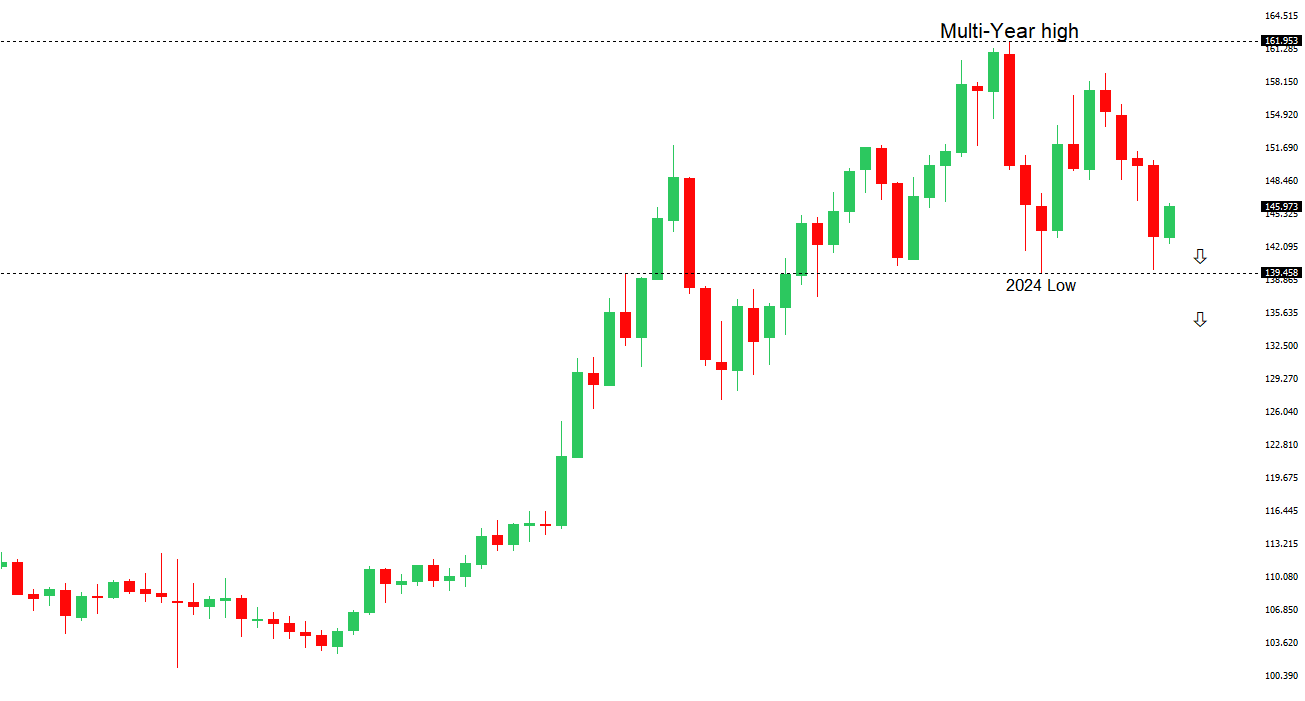 | ||
| R2 150.00 - Psychological - Strong R1 148.65 - 12 May high - Medium S1 145.70 - 12 May low - Medium S1 144.82 - 9 May low - Medium | ||
| USDJPY: fundamental overview | ||
| USDJPY is tracking the narrowing spread between US and Japanese 10-year yields, with Japan’s yields reaching a two-week high. ING analysts are predicting the yen will strengthen, eyeing USDJPY 140.00, as the Bank of Japan is expected to resume rate hikes by 25 basis points in Q3 while the Federal Reserve may restart rate cuts. Renewed talks between the US and Asian economies, including Japan and South Korea, on currency matters are reviving May’s “currency appreciation for trade accords” narrative, which previously drove the Bloomberg Asia Dollar Index higher, with the yen poised to benefit significantly. Japan’s Prime Minister Ishiba aims to secure a trade deal with the US by July, coinciding with the end of the “Liberation Day” tariff pause and Japan’s upper house elections, though high auto tariffs could delay an agreement to avoid political backlash. A successful trade deal could shift market focus back to BOJ rate hikes, as tariff uncertainties have been a key obstacle. | ||
| AUDUSD: technical overview | ||
| There are signs of the potential formation of a longer-term base with the market trading down into a meaningful longer-term support zone. Only a monthly close below 0.5500 would give reason for rethink. A monthly close back above 0.7000 will take the big picture pressure off the downside and strengthen case for a bottom. | ||
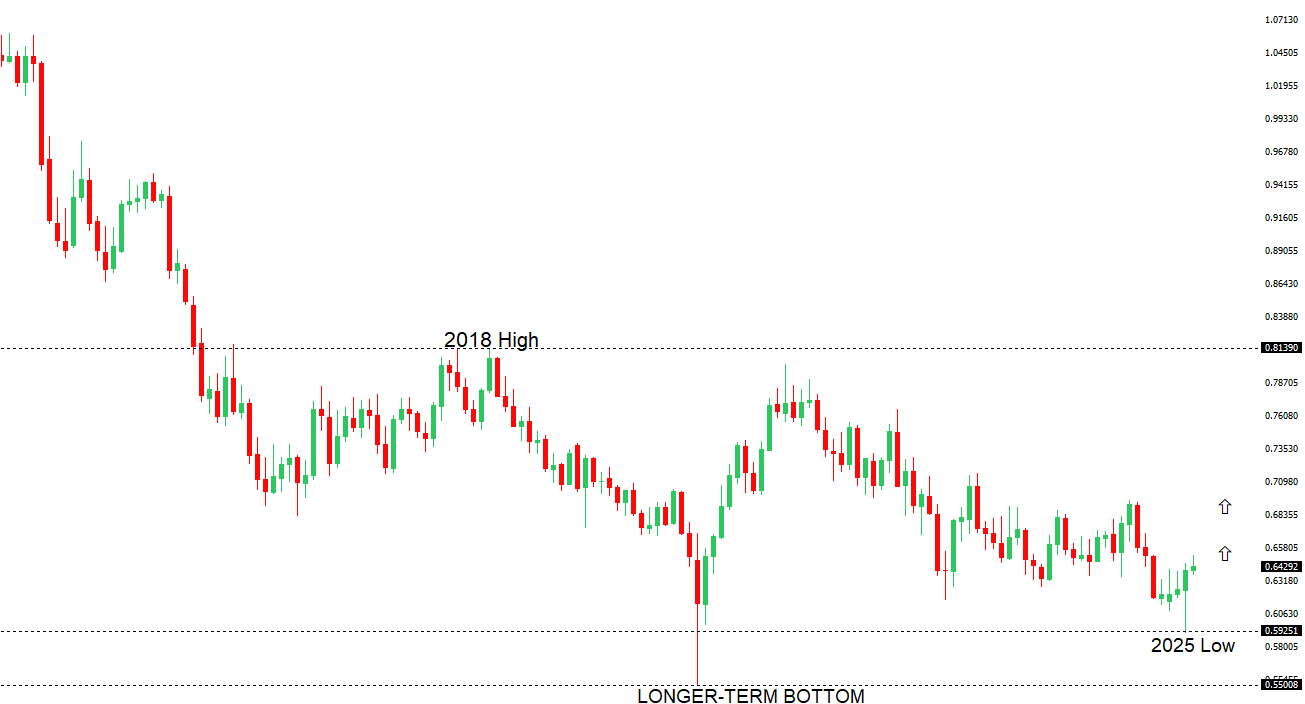 | ||
| R2 0.6550 - 25 November high - Strong R1 0.6515 - 7 May/2025 high - Medium S1 0.6344 - 24 April low - Medium S1 0.6275 - 14 April low - Strong | ||
| AUDUSD: fundamental overview | ||
| The People’s Bank of China set the yuan’s daily reference rate at 7.1956, weaker than the Bloomberg survey’s expectation of 7.1842, marking the first such divergence since November and signaling cautious management to prevent rapid yuan appreciation that could harm export competitiveness amid economic stabilization efforts. This stance supported a rebound in offshore USDCNH and limited gains in antipodean currencies, though a temporary trade truce and renewed currency appreciation talks among Asian competitors like Japan and South Korea could ease China’s concerns, potentially allowing faster yuan appreciation and boosting antipodean currencies. In Australia, April’s employment surged by 89,000, with full-time jobs up 59,500, pushing the participation rate to a near-record 67.1% while unemployment held at 4.1%; despite consumer inflation expectations easing to 4.1%, persistent price pressures and global tariff risks may not deter the Reserve Bank of Australia from a likely rate cut on May 20, though robust jobs data could temper expectations for further easing this year. | ||
| Suggested reading | ||
| The $40bn bitcoin bet, K. Martin, Financial Times (May 14, 2025) The China Deal Doesn’t Solve The Fed’s Problem, B. Dudley, Bloomberg (May 14, 2025) | ||