 | ||
| 28th July 2025 | view in browser | ||
| Global markets brace for trade and political shifts | ||
| The US and EU agreed on a 15% tariff deal for most EU exports, though disagreements persist over whether pharmaceuticals are included, while Japan clarified that its $550 billion investment deal with the US depends on contributions, signaling ongoing trade negotiations and potential tensions under the Trump administration. | ||
| Performance chart 30day v. USD (%) | ||
 | ||
| Technical & fundamental highlights | ||
| EURUSD: technical overview | ||
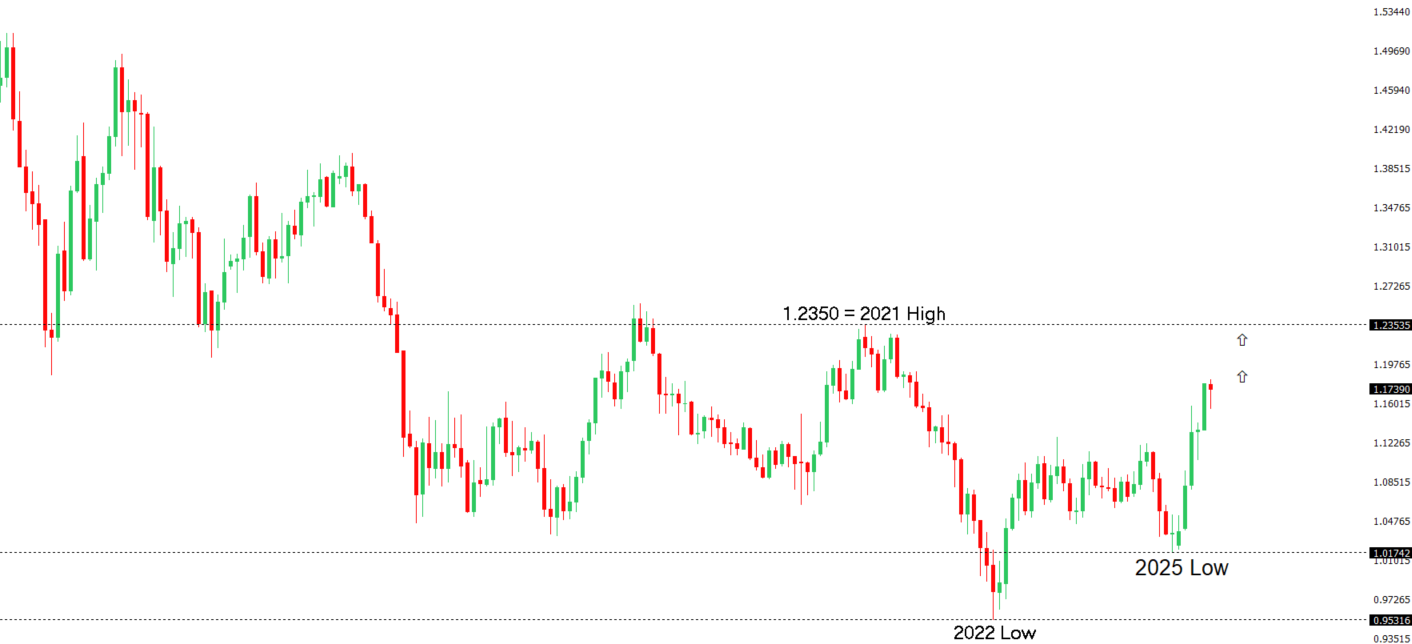
| The Euro has broken out from a multi-month consolidation off a critical longer-term low. This latest push through the 2023 high (1.1276) lends further support to the case for a meaningful bottom, setting the stage for a bullish structural shift and the next major upside extension targeting the 2021 high at 1.2350. Setbacks should be exceptionally well supported ahead of 1.1000. | ||
 | ||
| R2 1.1830 - 1 July/2025 high - Strong R1 1.1789 - 24 July high - Medium S1 1.1557 - 17 July low - Medium S2 1.1446 - 19 June low - Strong | ||
| EURUSD: fundamental overview | ||
| The US and EU reached a 15% tariff deal on most EU exports, though disputes remain over whether pharmaceuticals are included, with steel and aluminum facing quotas. The EU offered concessions like buying $750 billion in US energy and investing $600 billion in the US, but European industry groups criticized the deal as unbalanced. The Euro saw a muted response but could strengthen as the ECB’s 2% deposit rate pause may hold, supported by stable inflation forecasts (2.0% for 2025) and positive Eurozone data, including a strong Q1 2025 GDP growth of 0.6% and a rising Composite PMI of 51.0. With expectations of US rate cuts growing, diverging central bank policies may bolster the Euro. | ||
| USDJPY: technical overview | ||
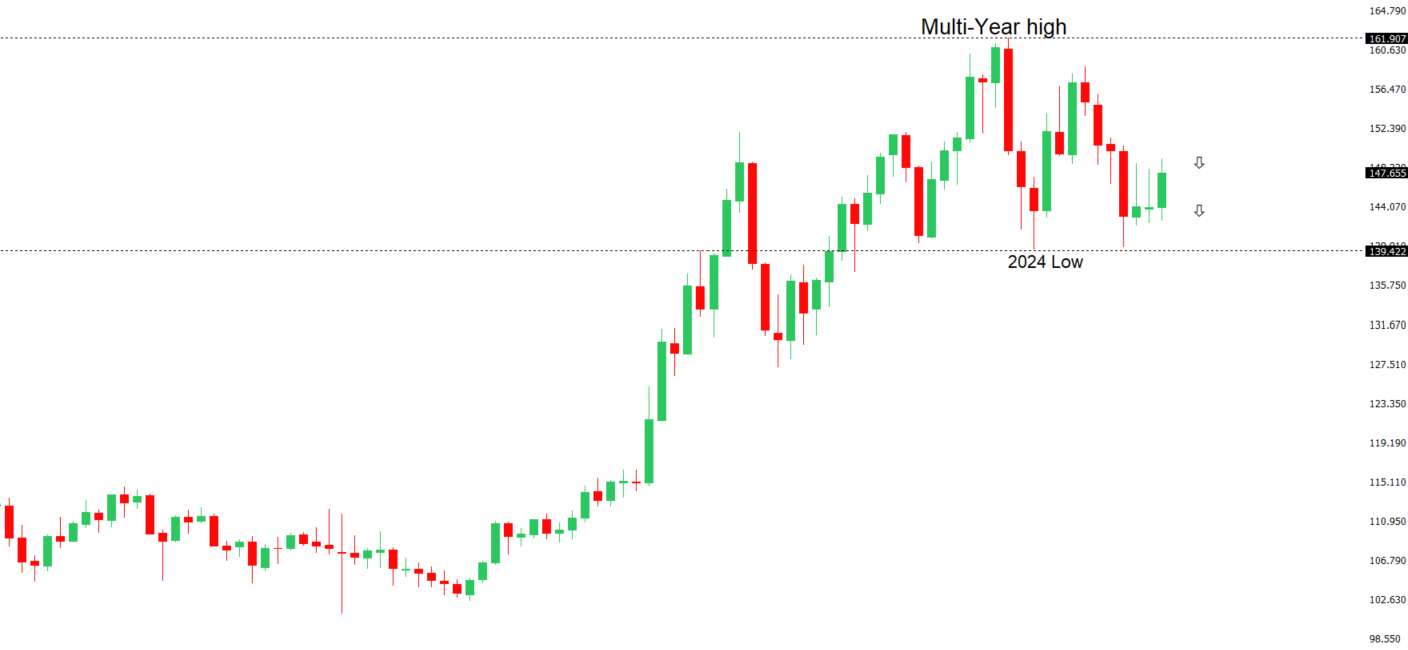
| There are signs of a meaningful top in place after the market put in a multi-year high in 2024. At this point, the door is now open for a deeper setback below the 2024 low at 139.58, exposing a retest of the 2023 low. Rallies should be well capped below 152.00. | ||
 | ||
| R2 150.00 - Psychological - Strong R1 149.19 - 16 July high - Medium S1 146.11 - 23 July low - Medium S2 145.85 - 24 July low - Strong | ||
| USDJPY: fundamental overview | ||
| Despite the US-Japan trade deal reducing economic uncertainty, it offers little political protection for Japanese Prime Minister Ishiba, whose leadership faces scrutiny at an informal LDP meeting today that could lead to a leadership contest, with Shinjiro Koizumi and Sanae Takaichi as potential successors. Koizumi supports BOJ independence, while Takaichi’s preference for monetary easing and a weaker Yen could hinder rate hikes if she becomes PM. The BOJ is likely to hold rates steady at its Thursday meeting, with markets awaiting its inflation outlook and hints of future rate hikes, supported by strong economic data like June retail sales, which early reports suggest may show robust consumer spending. | ||
| AUDUSD: technical overview | ||
| There are signs of the potential formation of a longer-term base with the market trading down into a meaningful longer-term support zone. Only a monthly close below 0.5500 would give reason for rethink. A monthly close back above 0.7000 will take the big picture pressure off the downside and strengthen case for a bottom. | ||
 | ||
| R2 0.6688 - 7 November 2024 high - Strong R1 0.6625 - 24 July/2025 high - Medium S1 0.6454 - 17 July low - Medium S1 0.6373 - 23 June low - Strong | ||
| AUDUSD: fundamental overview | ||
| The Australian Dollar is gaining strength due to positive market sentiment following US-Japan and US-EU trade deals, with expectations of a US-China tariff truce extension further boosting optimism. Australian super funds, managing A$4.1 trillion in assets, are likely increasing AUD hedging, supporting the currency’s rise to yearly highs. While the upcoming 2Q CPI report, expected to show inflation easing to 2.2% and core at 2.7%, may prompt an RBA rate cut in August, Governor Bullock’s recent comments downplaying aggressive cuts and highlighting a stable labor market despite a 4.3% unemployment rate have reduced expectations for multiple rate cuts, with markets now awaiting clearer signs of slowing inflation or weaker economic data. | ||
| Suggested reading | ||
| Parsing What the GENIUS Act Means for Markets, Fisher Investments (July 24, 2025) The Best Time to Invest, B. Carlson, A Wealth of Common Sense (July 24, 2025) | ||


