


 | ||
| 23rd March 2026 | view in browser | ||
| Macro jitters rise on Hormuz threat | ||
| Markets open the day cautiously as escalating Middle East tensions drive energy and inflation risks higher, while policymakers in Japan and New Zealand respond to mounting FX and fiscal pressures ahead of key global data and central bank signals. | ||
| Performance chart 30day v. USD (%) | ||
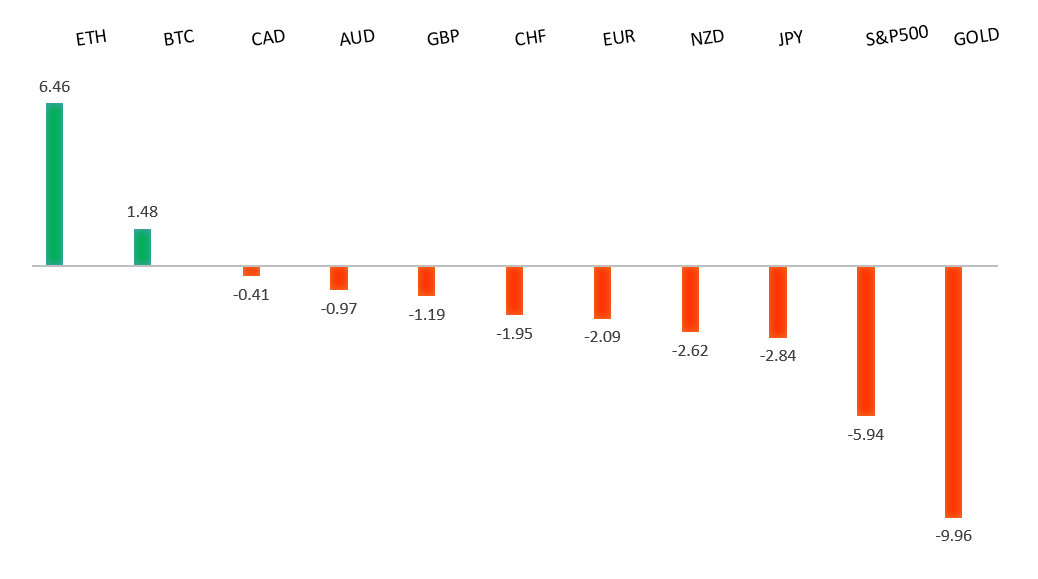 | ||
| Technical & fundamental highlights | ||
| EURUSD: technical overview | ||
| The Euro outlook remains constructive with higher lows sought out on dips in favor of the next major upside extension targeting the 2021 high at 1.2350. Setbacks should be exceptionally well supported ahead of 1.1300. | ||
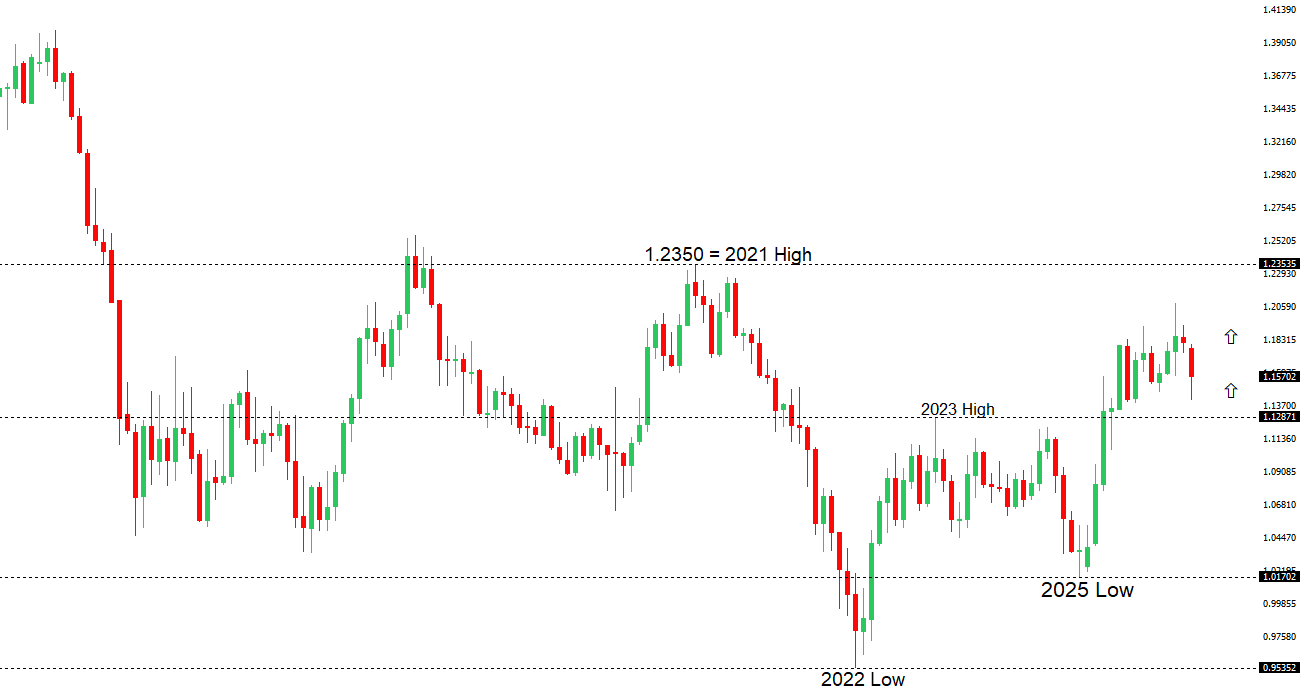 | ||
| R2 1.1668 - 10 March high - Strong R1 1.1617 - 19 March high - Medium S1 1.1411 - 13 March/2026 low - Medium S2 1.1400 - Figure - Strong | ||
| EURUSD: fundamental overview | ||
| Amid an ongoing Iran conflict that’s keeping the Strait of Hormuz effectively closed, elevated oil and gas prices are heightening eurozone inflation risks, prompting hawkish signals from ECB officials like Joachim Nagel, who indicated a possible rate hike as early as April if the outlook worsens. At the same time, soaring energy costs pose a growing drag on European growth and recovery efforts. Escalating threats—Trump warning of obliterating Iran’s power plants if the strait isn’t reopened, and Iran vowing retaliation against US and Israeli energy assets—continue to fuel supply disruption fears. Over the next 1-2 weeks, the euro is likely to face downside pressure against the dollar if oil stays high and headlines emphasize risks rather than de-escalation, though potential ECB tightening should cap any sharp falls. Analyst views have shifted more hawkish ahead of the March 20-21 period, with some now eyeing an April hike, while key upcoming Eurozone data includes flash PMIs, consumer confidence, ECB inflation expectations, and German IFO and GfK surveys. | ||
| USDJPY: technical overview | ||
| There are signs of the formation of a meaningful top after the market put in a multi-year high in 2024. At this point, rallies should be well capped above 160.00 in favor of a fresh down-leg back towards the 2024 low at 139.58. Only a monthly close above 160.00 negates. | ||
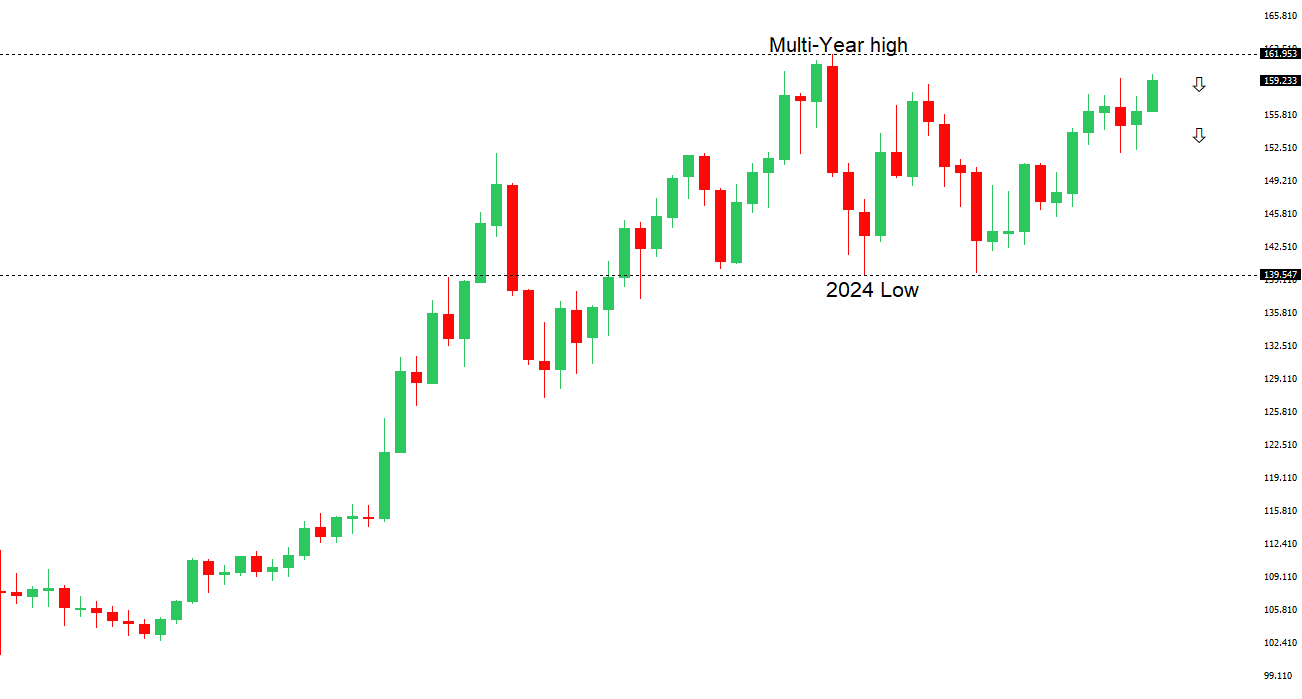 | ||
| R2 160.00 - Psychological - Strong R1 159.91 - 18 March/2026 high - Medium S1 157.27 - 10 March low - Medium S2 156.45 - 5 March low - Strong | ||
| USDJPY: fundamental overview | ||
| The Japanese yen continues to weaken modestly, with USDJPY pushing back toward 160 despite renewed verbal intervention warnings from top official Mimura, who cited speculative oil price moves tied to Middle East tensions as a key driver of FX volatility and stressed authorities’ readiness to act decisively against excessive swings. This reflects heightened official concern over oil-driven flows pressuring the yen, given Japan’s heavy energy import reliance and limited yield support compared to other G-10 currencies. Following the BoJ’s recent hold at 0.75% with a data-dependent tightening bias, the yen remains highly sensitive to oil prices, inflation, and geopolitical headlines in the near term, with limited recovery expected unless crude falls sharply or the BoJ turns more hawkish; key data like February CPI (likely softened by subsidies) and March PMIs will be in focus this week. | ||
| AUDUSD: technical overview | ||
| There are signs of the formation of a longer-term base with the market recovering out from a meaningful longer-term support zone. The latest monthly close back above 0.7000 takes the big picture pressure off the downside and strengthens the case for a bottom, with the focus now on a push towards 0.8000. Setbacks should now be well supported ahead of 0.6700. | ||
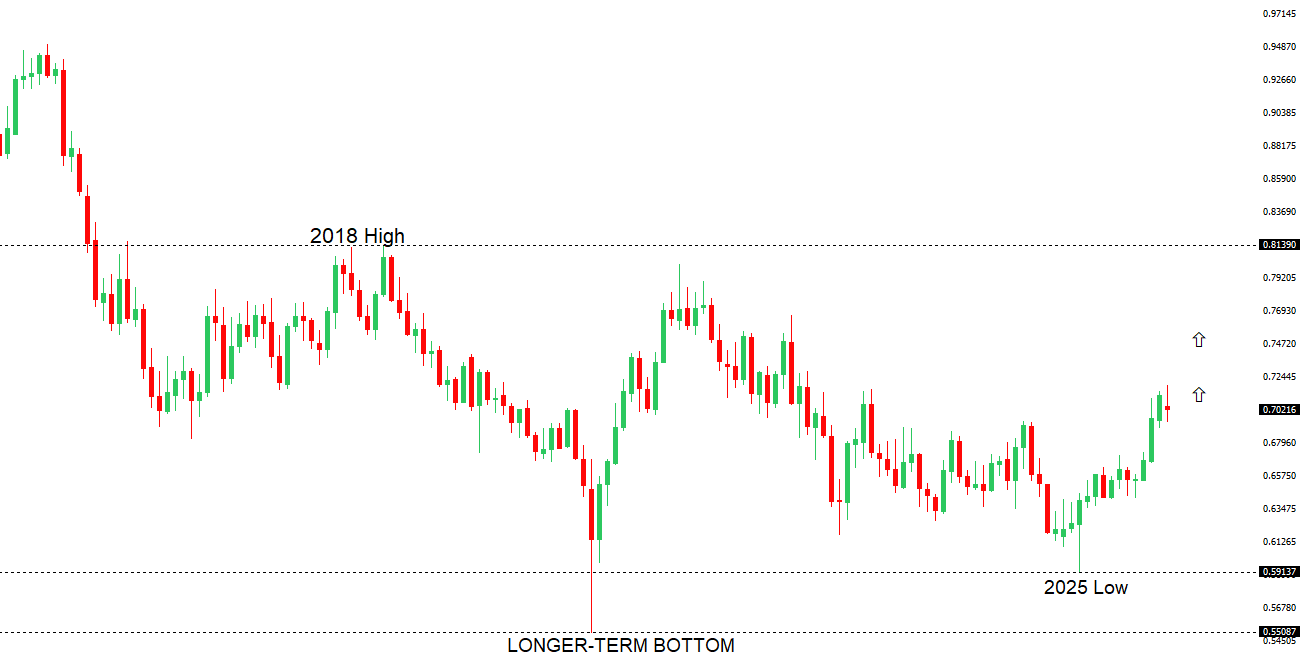 | ||
| R2 0.7200 - Figure - Medium R1 0.7188 - 11 March/2026 high - Medium S1 0.6944 - 3 March low - Medium S2 0.6897 - 6 February low - Strong | ||
| AUDUSD: fundamental overview | ||
| The Australian dollar is down today, slipping below its 50-day moving average amid a strong US dollar and falling Asian equities, though its broader bullish structure remains intact. Powerful tailwinds from surging Australian 10-year bond yields (above 5%, multi-year highs) and rising commodity prices—fueled by Middle East tensions and higher oil/gas—are boosting the AUD’s rate advantage, improving terms of trade, and attracting inflows. Despite occasional risk-off pressure, the medium-term outlook stays constructive thanks to elevated carry, a hawkish RBA bias (with markets pricing in further hikes, possibly as soon as May), and commodity support. Over the next 1–2 weeks, AUDUSD should trade with a mild upside tilt within the 0.69–0.72 range, with dips well bought on high domestic yields and RBA tightening expectations, while upside remains capped by periodic USD strength and geopolitical headlines—favoring buying shallow pullbacks over chasing rallies ahead of key Australian data like March PMIs and February CPI. | ||
| Suggested reading | ||
| A salt and pepper view of the interest rate outlook, P. O’Hare, Briefing (March 20, 2026) Powell’s Pause: A Gamble Wrapped in Uncertainty, J. Picerno, Capital Spectator (March 19, 2026) | ||