


 | ||
| 11th June 2025 | view in browser | ||
| Markets eye US CPI amid global trade optimism | ||
| The US dollar holds firm as markets await the May US CPI data and the third round of US-China trade talks in London, with cautious optimism stemming from progress on resolving China’s rare earth export restrictions and potential US tech export relief, though concerns linger over Trump’s trade and fiscal policies. | ||
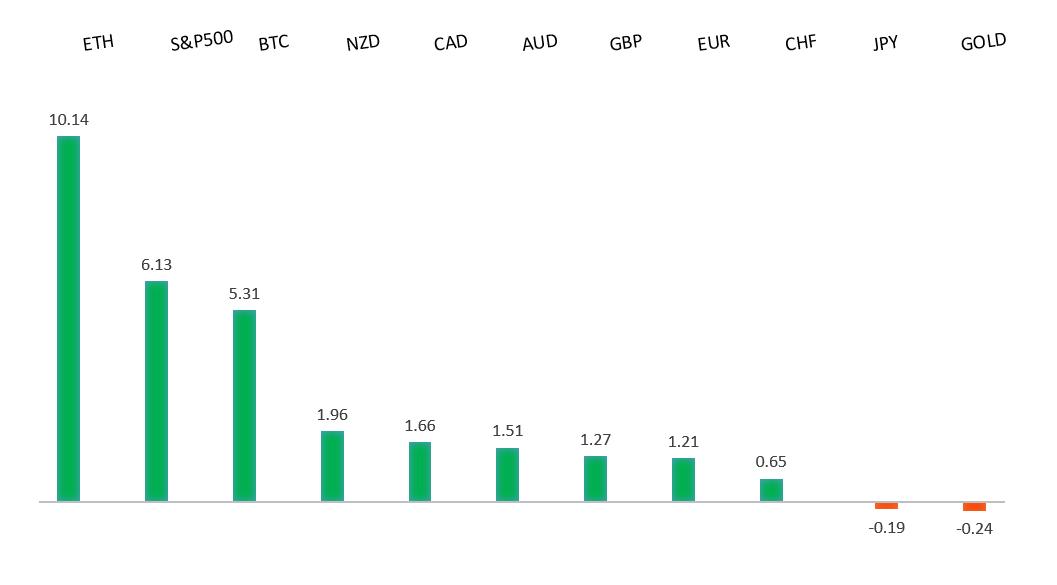
| Performance chart 30day v. USD (%) | ||
 | ||
| Technical & fundamental highlights | ||
| EURUSD: technical overview | ||
| The Euro has finally broken out from a multi-month consolidation off a critical longer-term low. This latest push through the 2023 high lends further support to the case for a meaningful bottom, setting the stage for a bullish structural shift and the next major upside extension targeting the 2021 high at 1.2350. Setbacks should be exceptionally well supported below 1.1000. | ||
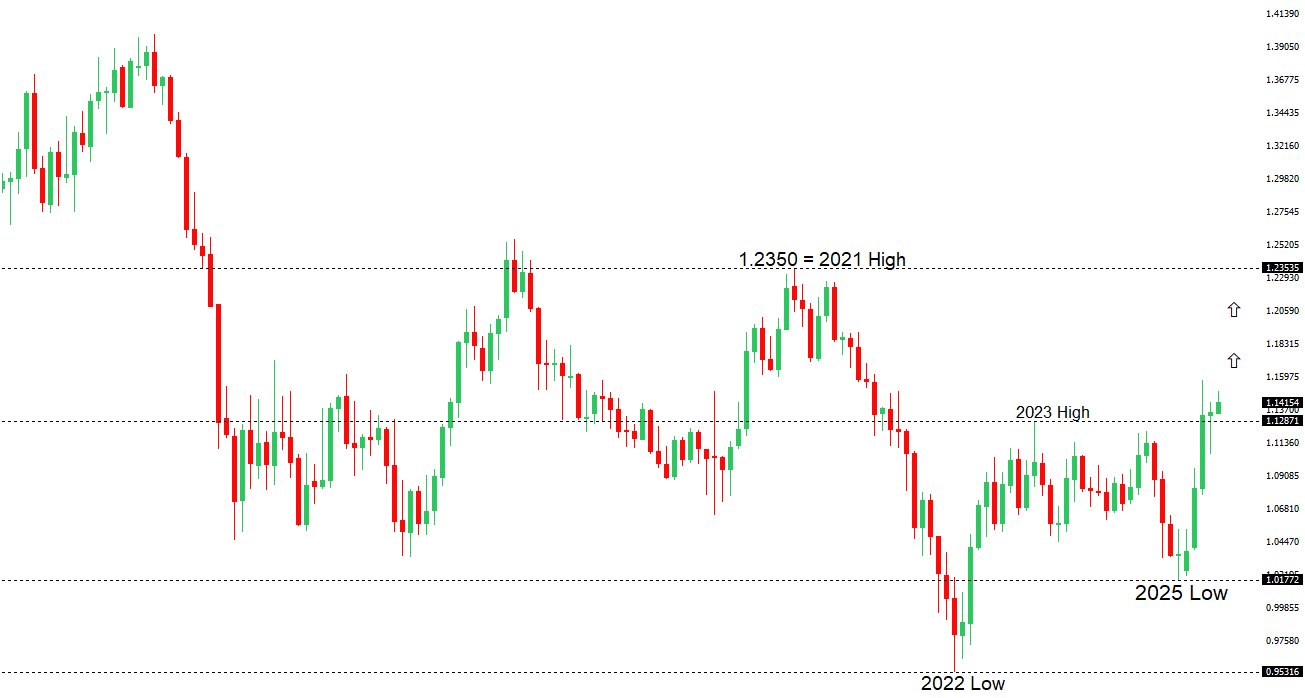 | ||
| R2 1.1574 - 21 April/2025 high - Strong R1 1.1495 - 5 June high - Medium S1 1.1210 - 29 May low - Medium S2 1.1065 - 12 May low - Strong | ||
| EURUSD: fundamental overview | ||
| The eurozone economy is recovering, with 0.6% growth in Q1 2025 and inflation at the ECB’s 2% target, following the ECB’s eighth consecutive rate cut, lowering the deposit rate to 2%. ECB President Christine Lagarde indicated the easing cycle may be nearing its end, while officials like François Villeroy de Galhau see policy as “normalized” but flexible, though Robert Holzmann expects steady rates through summer and Boris Vujcic awaits clearer economic and US tariff data by September. Amid global trade uncertainties, ECB members like Isabel Schnabel and Yannis Stournaras see a chance to boost the euro’s international role as a safe-haven asset, with upcoming speeches from Lagarde, Lane, and Cipollone expected to clarify ECB policy direction. | ||
| USDJPY: technical overview | ||
| There are signs of a meaningful top in place after the market put in a multi-year high in 2024. At this point, the door is now open for a deeper setback below the 2024 low at 139.58 over the coming sessions exposing a retest of the 2023 low. Rallies should be well capped below 150.00. | ||
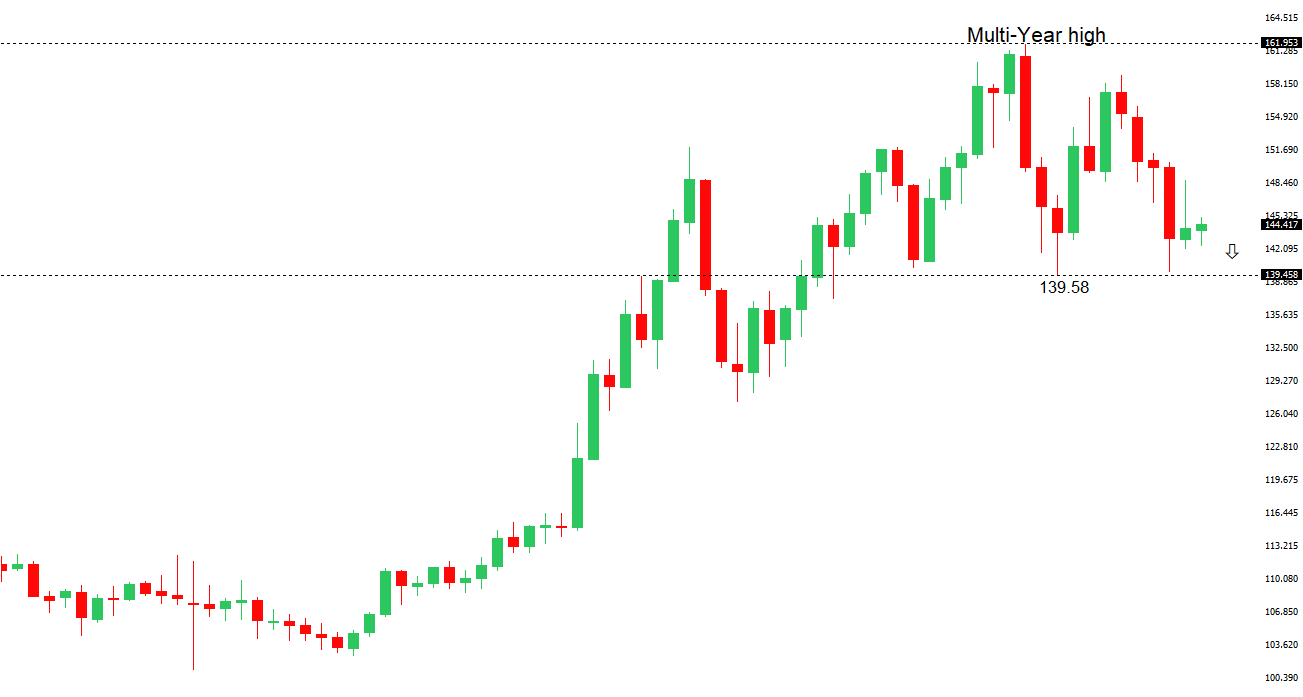 | ||
| R2 148.65 - 12 May high - Medium R1 146.29 - 29 May high - Medium S1 142.11 - 27 May low - Medium S2 141.97 - 29 April low - Medium | ||
| USDJPY: fundamental overview | ||
| The yen hit a two-week low as improved risk appetite reduced demand for safe-haven assets, while Japanese stocks rose, with the Nikkei up 0.4% and Topix up 0.2%, driven by tech gains from companies like Advantest (+3.2%), Lasertec (+3.4%), and Tokyo Electron (+2.6%), fueled by optimism over US-China trade talks. Inflation in Japan eased, with producer prices up 3.2% in May, but BOJ Governor Ueda maintained a hawkish stance, ready to raise rates if inflation nears 2%. Meanwhile, a selloff in Japanese government bonds, coupled with Japan’s 250% debt-to-GDP ratio, raises concerns for banks and insurers facing potential losses and credit rating risks. | ||
| AUDUSD: technical overview | ||
| There are signs of the potential formation of a longer-term base with the market trading down into a meaningful longer-term support zone. Only a monthly close below 0.5500 would give reason for rethink. A monthly close back above 0.7000 will take the big picture pressure off the downside and strengthen case for a bottom. | ||
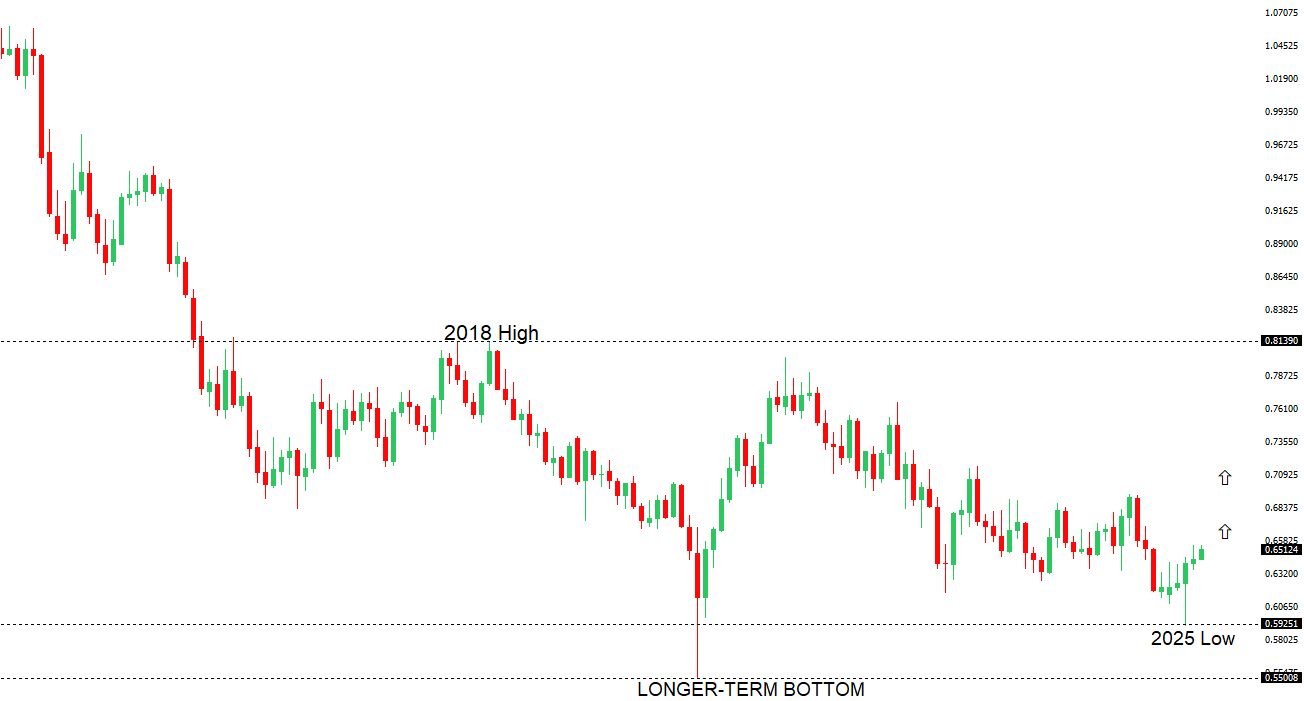 | ||
| R2 0.6550 - 25 November 2024 high - Strong R1 0.6539 - 5 June/2025 high - Medium S1 0.6344 - 24 April low - Medium S1 0.6275 - 14 April low - Strong | ||
| AUDUSD: fundamental overview | ||
| The Australian stock market rose on Wednesday, with the ASX 200 up 0.3% to a record high, buoyed by optimism over US-China trade talks despite weaker local currencies. Over 60% of stocks in both indices traded above their 200-day moving averages, reflecting strong market breadth. Weak Australian economic data, including 0.2% Q1 growth and declining consumer and business activity, has fueled concerns that the Reserve Bank of Australia may need to cut rates soon. | ||
| Suggested reading | ||
| Could the degrowth movement save our planet?, S. Keynes, Financial Times (June 10, 2025) With Pause Soon to Expire, Where Are the Deals?, J. Calhoun, Alhambra Investments (June 8, 2025) | ||