


 | ||
| 16th February 2026 | view in browser | ||
| Markets tread water in holiday-thinned session | ||
| Markets are starting the week quietly due to the US holiday, with the yen weakening on soft Japanese growth data, the dollar holding slightly softer after mixed US releases and cautious Fed commentary, and attention turning to light data, central bank speakers, and geopolitical remarks reinforcing US-Europe strategic ties. | ||
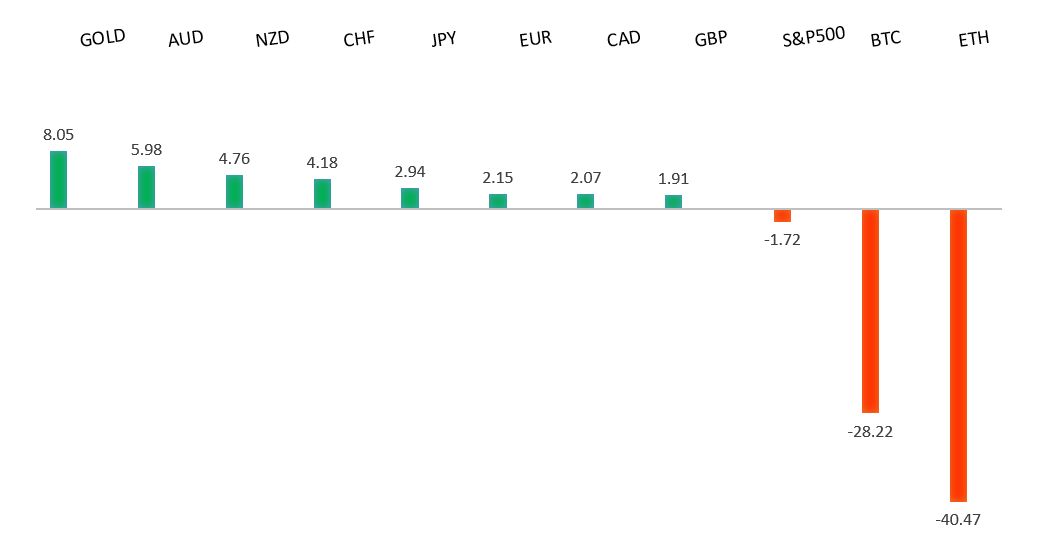
| Performance chart 30day v. USD (%) | ||
 | ||
| Technical & fundamental highlights | ||
| EURUSD: technical overview | ||
| The Euro outlook remains constructive with higher lows sought out on dips in favor of the next major upside extension targeting the 2021 high at 1.2350. Setbacks should be exceptionally well supported ahead of 1.1500. | ||
 | ||
| R2 1.2081 - 27 Janaury/2026 high - Strong R1 1.1929 - 10 February high - Medium S1 1.1765 - 6 February low - Medium S2 1.1728 - 23 January low - Medium | ||
| EURUSD: fundamental overview | ||
| The Euro is steady after four straight days of losses, holding near the roughly four-year high of $1.2081 reached in late January. ECB President Lagarde struck an optimistic tone, emphasizing incentives over taxes and suggesting that US trade tensions could accelerate European reforms, while noting continued capital inflows into Europe. The ECB also announced plans to expand repo access to more central banks starting in Q3 2026, supporting euro liquidity and reinforcing its global role. Markets now turn to upcoming data, including Sweden’s January unemployment rate and Eurozone industrial production for December. | ||
| USDJPY: technical overview | ||
| There are signs of a meaningful top in place after the market put in a multi-year high in 2024. At this point, rallies should be well capped ahead of 160.00 in favor of a fresh down-leg back towards the 2024 low at 139.58. The recent break below 154.39 strengthens the outlook. | ||
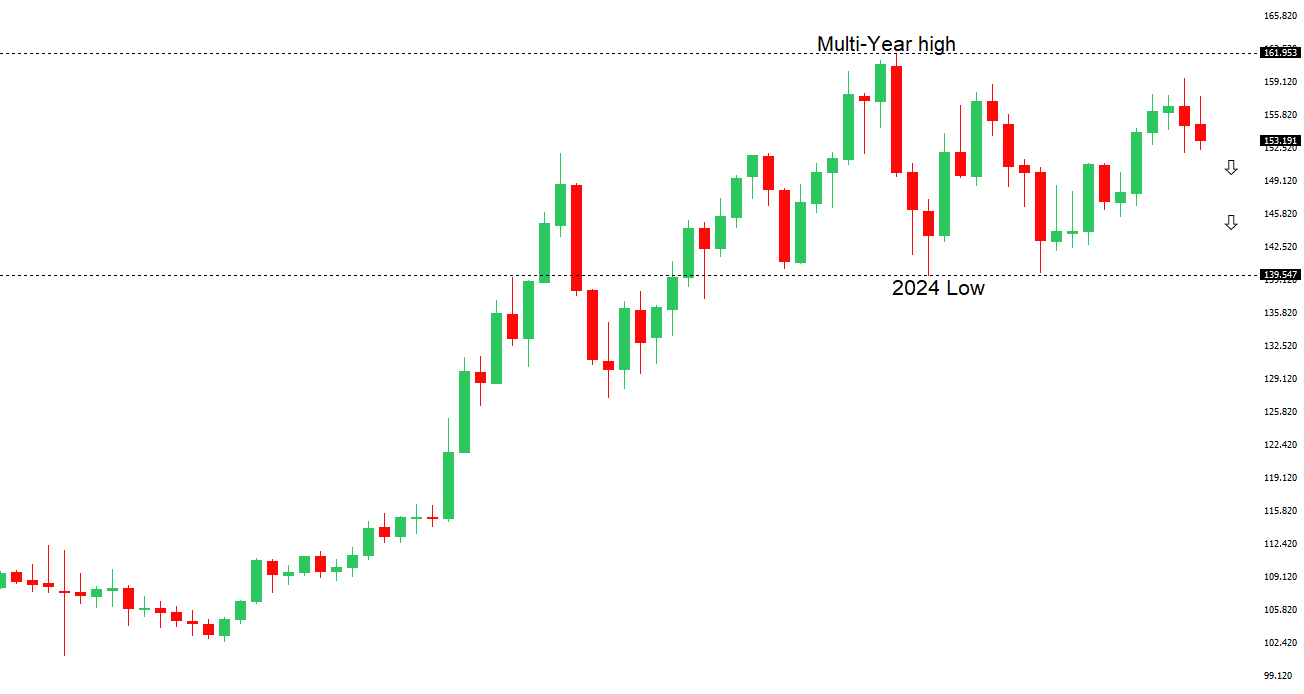 | ||
| R2 156.30 - 10 February high - Medium R1 154.52 - 11 February high - Medium S1 152.24 - 12 February low - Medium S2 151.97 - 28 January/2026 low - Strong | ||
| USDJPY: fundamental overview | ||
| The pair is on track to snap a five-day losing streak, though it remains close to last Thursday’s two-week low of 152.24. Japan’s preliminary fourth-quarter GDP disappointed due to weak business spending, while the GDP deflator held firm at 3.4% year-over-year, pointing to ongoing inflation pressures. BoJ member Tamura indicated the 2% inflation target could be achieved as soon as spring if wage growth continues, highlighting growing pressure on Governor Ueda to proceed with policy normalization. Overall, the medium-term outlook increasingly reflects gradual BoJ tightening alongside a less aggressively hawkish Federal Reserve. | ||
| AUDUSD: technical overview | ||
| There are signs of the formation of a longer-term base with the market recovering out from a meaningful longer-term support zone. A monthly close back above 0.7000 will take the big picture pressure off the downside and strengthen case for a bottom. Setbacks should now be well supported ahead of 0.6700. | ||
 | ||
| R2 0.7158 - 2023 high - Strong R1 0.7147 - 12 February/2026 high - Strong S1 0.7005 - 9 February low - Medium S2 0.6897 - 6 February low - Strong | ||
| AUDUSD: fundamental overview | ||
| The Aussie dollar is modestly higher, recovering some of Friday’s losses and holding near last week’s roughly three-year high of 0.7147. The currency remains supported by the RBA’s hawkish stance and solid domestic data, with markets pricing in about an 80% chance of a rate hike in May and a strong possibility of another later this year. Attention now turns to the upcoming RBA meeting minutes and Thursday’s jobs report, which will be key in shaping expectations for the policy outlook. | ||
| Suggested reading | ||
| Why A ‘K-Shaped’ Economy Makes Stocks Riskier, S. Hansen, Morningstar (February 13, 2026) AI Uncertainty Is Changing Investor Behavior, J. Wiggins, Behavioral Investment (February 10, 2026) | ||