


 | ||
| 8th July 2025 | view in browser | ||
| New tariffs fuel dollar rally, equities decline | ||
| On Monday, the U.S. dollar strengthened as President Trump announced new tariffs, including 25% on Japan, South Korea, Malaysia, and Kazakhstan, 30% on South Africa, and 40% on Laos, prompting widespread selling in U.S. stocks and Treasuries. | ||
| Performance chart 30day v. USD (%) | ||
 | ||
| Technical & fundamental highlights | ||
| EURUSD: technical overview | ||
| The Euro has broken out from a multi-month consolidation off a critical longer-term low. This latest push through the 2023 high lends further support to the case for a meaningful bottom, setting the stage for a bullish structural shift and the next major upside extension targeting the 2021 high at 1.2350. Setbacks should be exceptionally well supported below 1.1500. | ||
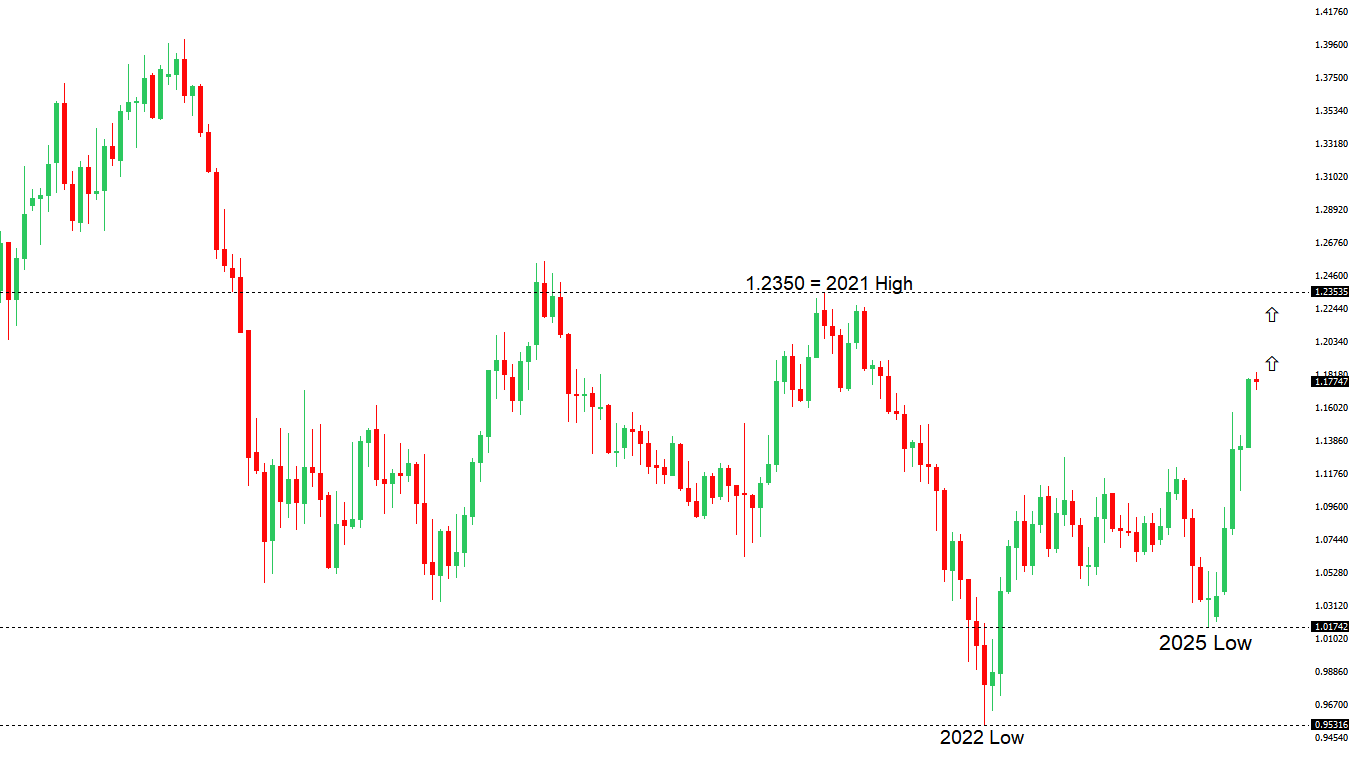 | ||
| R2 1.1900 - Figure - Medium R1 1.1830 - 1 July/2025 high - Medium S1 1.1687 - 7 July low - Medium S2 1.1654 - 26 June low - Medium | ||
| EURUSD: fundamental overview | ||
| The European Union is pushing to finalize a trade deal with the United States before the July 9 deadline, following positive talks between EU Commission President Ursula von der Leyen and President Trump, with a potential 10% tariff deal on the table. Recent Eurozone data shows mixed signals: July’s Sentix Investor Confidence surged to 4.5, the highest since February 2022, indicating fading recession fears and optimism for recovery, while Germany’s industrial production rebounded strongly in May. However, May retail sales in the Eurozone dipped slightly more than expected, though annual growth remains positive, suggesting resilient consumer demand but waning momentum. Overall, the data reflects early signs of economic stabilization, which could strengthen if US-EU trade uncertainties are resolved. | ||
| USDJPY: technical overview | ||
| There are signs of a meaningful top in place after the market put in a multi-year high in 2024. At this point, the door is now open for a deeper setback below the 2024 low at 139.58 over the coming weeks, exposing a retest of the 2023 low. Rallies should be well capped below 150.00. | ||
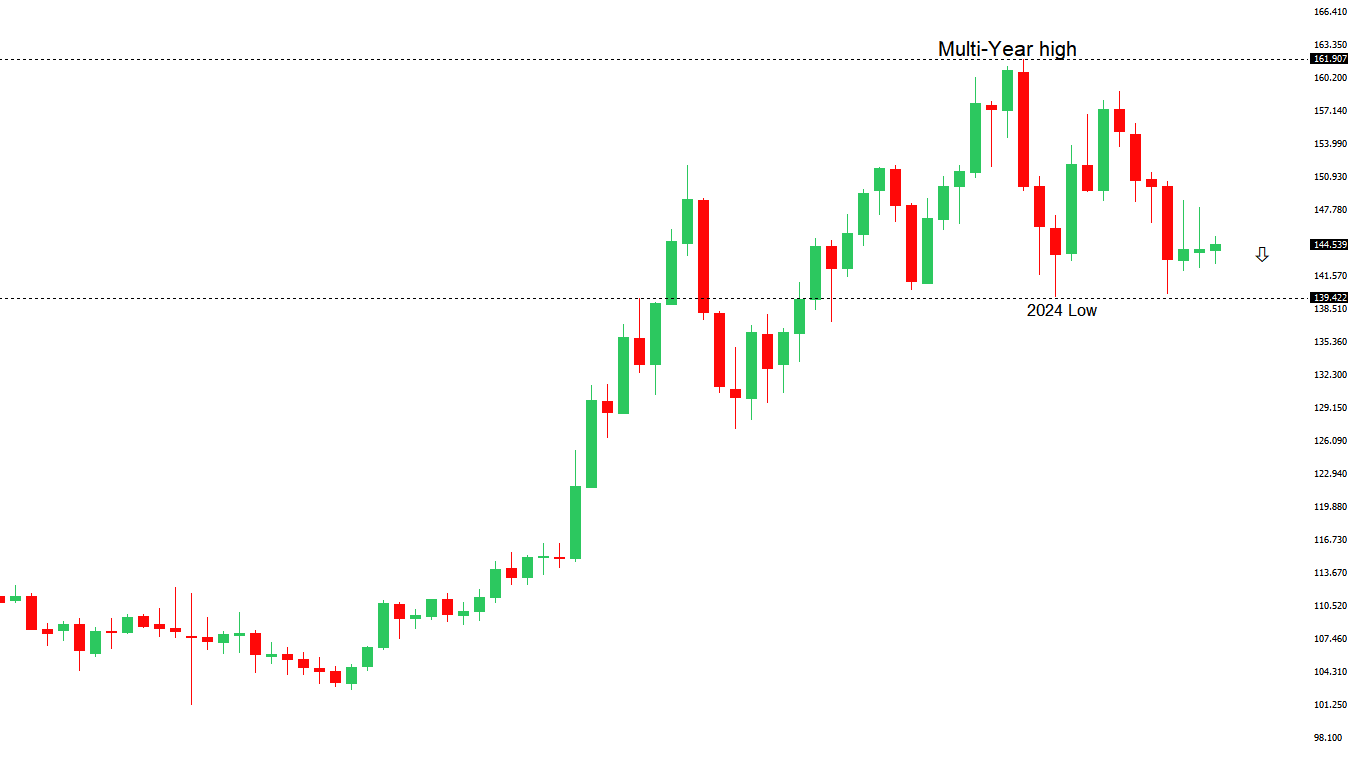 | ||
| R2 148.03 - 23 June high - Strong R1 147.00 - Figure - Medium S1 144.18 - 4 July low - Medium S2 142.68 - 1 July low - Strong | ||
| USDJPY: fundamental overview | ||
| Trump announced a 25% tariff on Japan effective August 1, giving Prime Minister Ishiba time to negotiate a trade deal before the July 20 upper house elections. Recent wage data showed weakness, with real wages dropping 2.9% in May—the steepest decline in 20 months—and nominal wages rising only 1%, below expectations. Despite this, stable full-time worker wages grew 2.4%, supporting the Bank of Japan’s view of a forming wage-price cycle that could justify future rate hikes. However, the tariff threat and weak wage data may complicate BOJ’s plans, as higher US tariffs could pressure corporate profits, particularly for manufacturers, making rate hikes more challenging without a favorable trade deal. | ||
| AUDUSD: technical overview | ||
| There are signs of the potential formation of a longer-term base with the market trading down into a meaningful longer-term support zone. Only a monthly close below 0.5500 would give reason for rethink. A monthly close back above 0.7000 will take the big picture pressure off the downside and strengthen case for a bottom. | ||
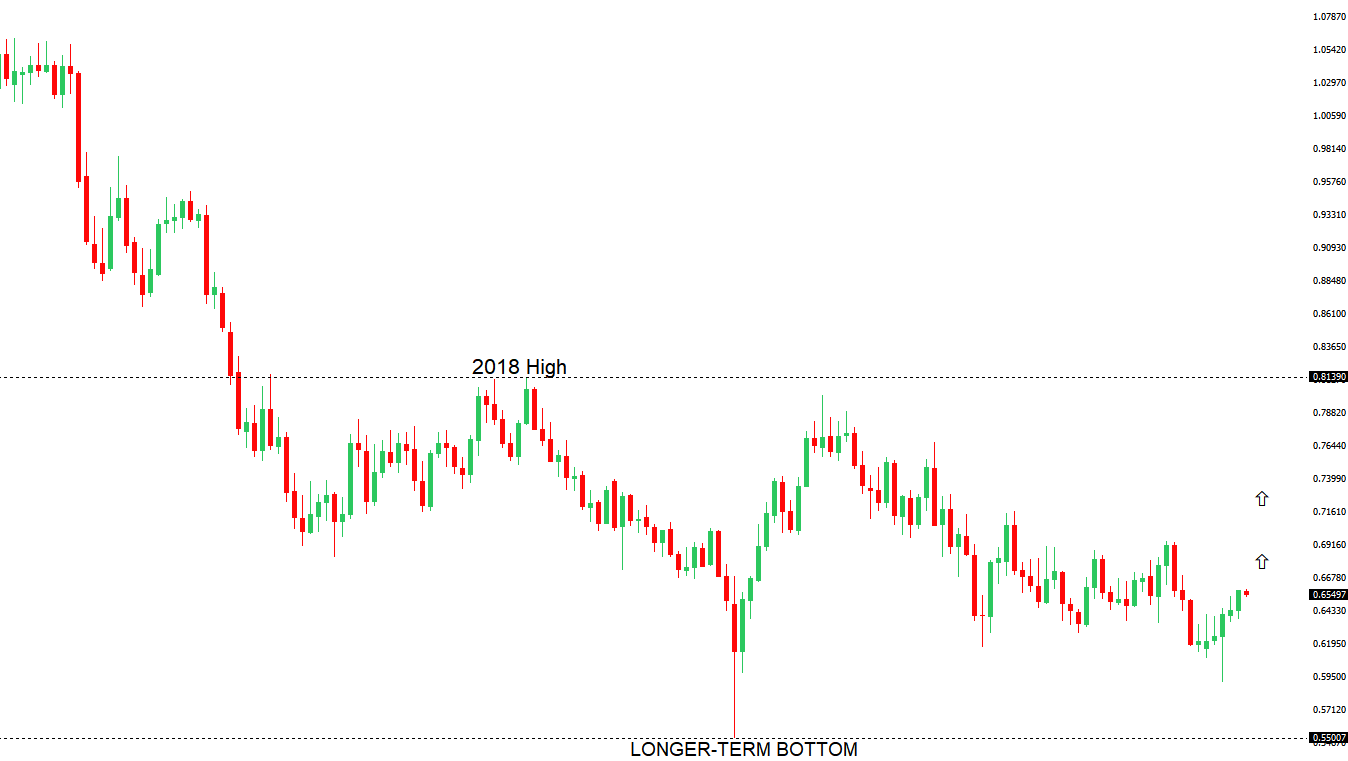 | ||
| R2 0.6600 - Medium - Strong R1 0.6591 - 1 July/2025 high - Medium S1 0.6484 - 25 June low - Medium S1 0.6373 - 23 June low - Strong | ||
| AUDUSD: fundamental overview | ||
| Trump’s threat of 10% tariffs on BRICS nations has raised fears of a renewed global trade war, complicating the fragile US-China trade truce. In Australia, mixed May spending data shows cautious retail but a surge in discretionary household spending, potentially reducing the urgency for aggressive rate cuts by the RBA. While markets expect a second RBA rate cut to 3.6% and more by year-end, one major US bank predicts a pause due to stable inflation, a tight labor market, and global uncertainties, with Governor Bullock’s comments likely to clarify the RBA’s stance. Recent data highlights labor market resilience, with June job ads up 1.8%. | ||
| Suggested reading | ||
| Say It Repeatedly, The Fed Isn’t Nor Can It Be ‘Independent’, J. Tamny, Forbes (July 6, 2025) Investing a Lump Sum at All-Time Highs, B. Carlson, AWOCS (July 4, 2025) | ||