Day Image
18th June 2025 | view in browser
US Dollar holds firm despite data misses

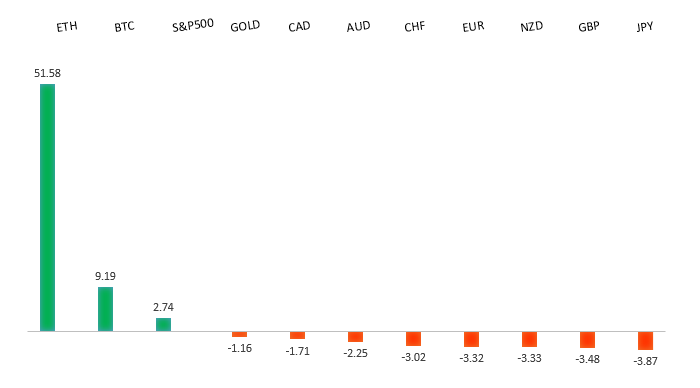
Despite recent U.S. economic data misses, the US Dollar remains strong, gaining notably against the Pound, which fell below 1.3500. U.S. stock futures show resilience, but escalating Israel-Iran tension raises concerns, with oil prices climbing amid fears of U.S. involvement.


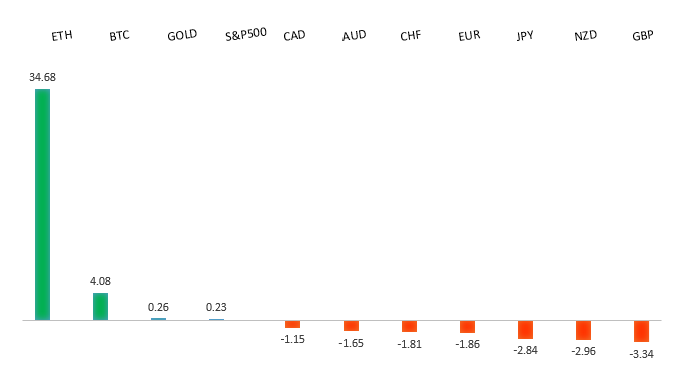
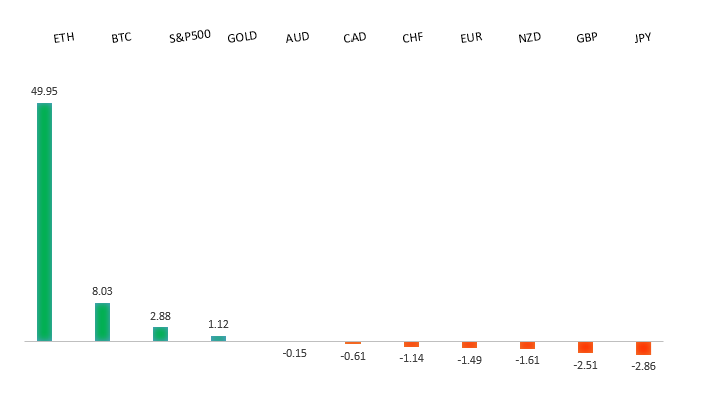
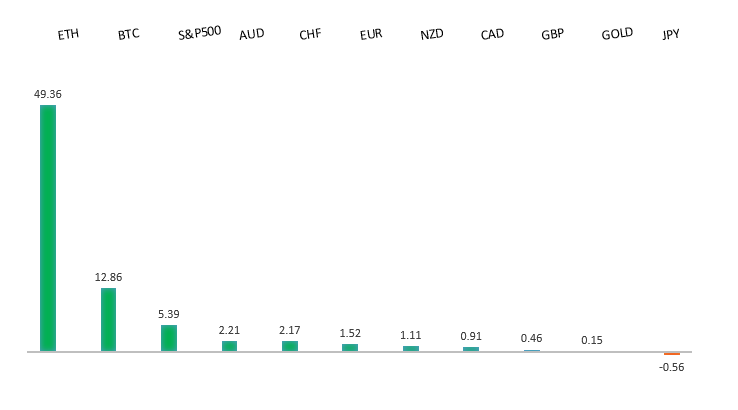
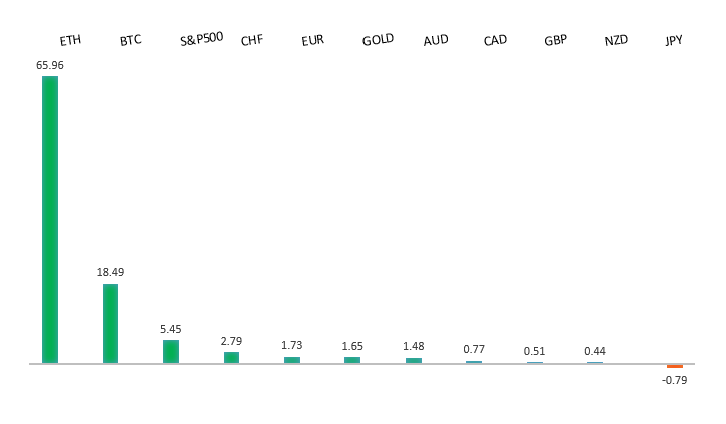
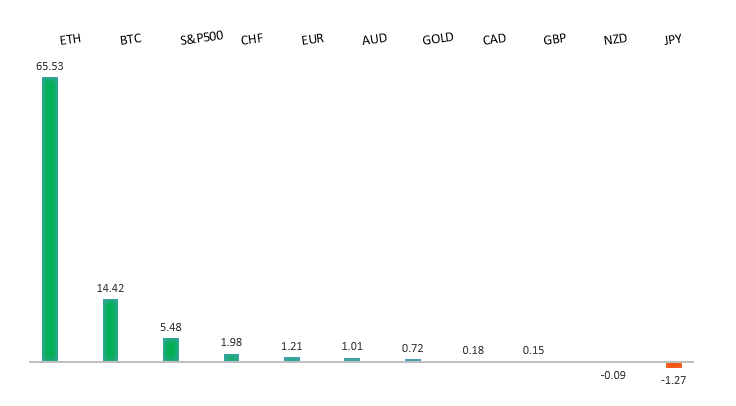
Performance chart 30day v. USD (%)
Performance Chart
 
 
Technical & fundamental highlights
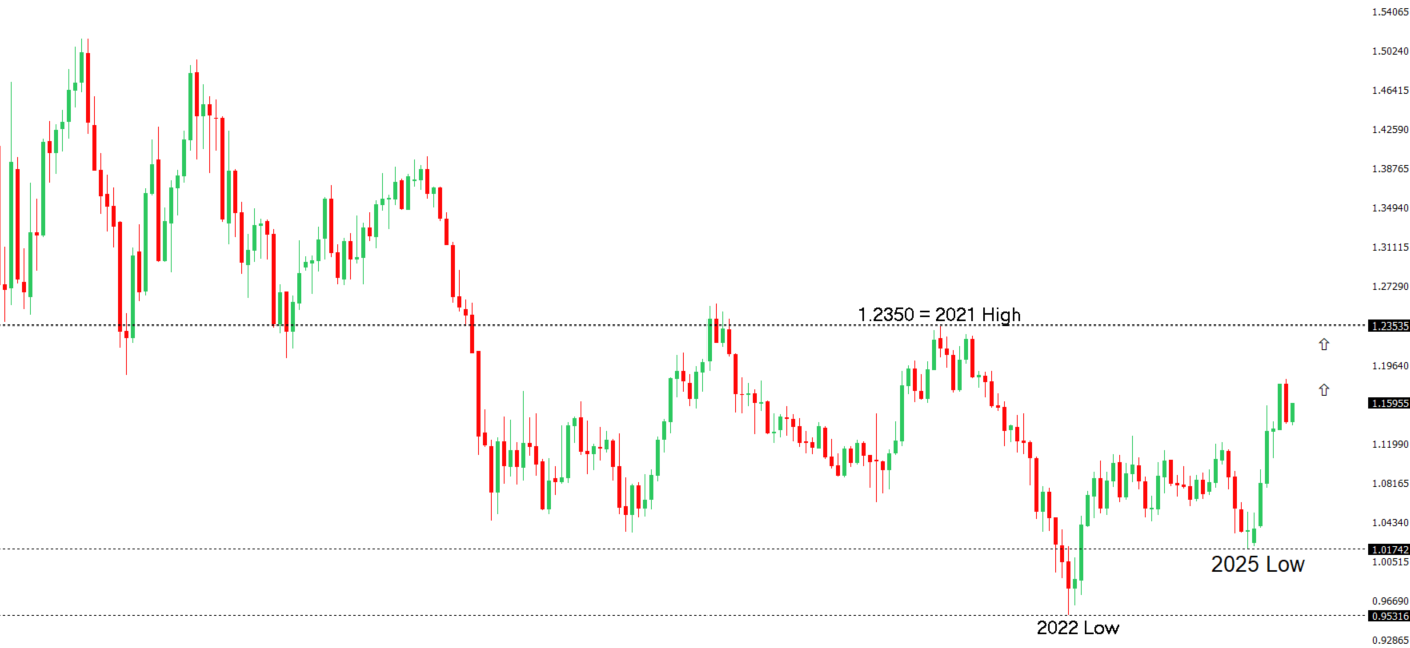
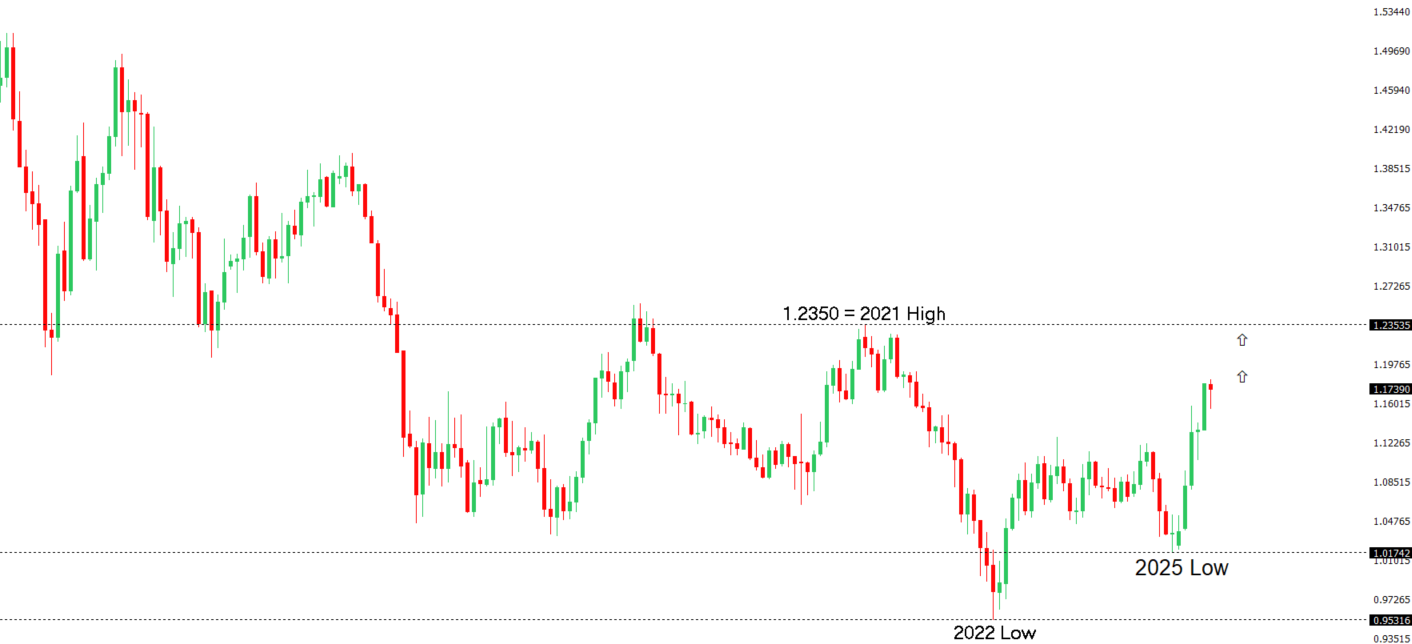
EURUSD: technical overview

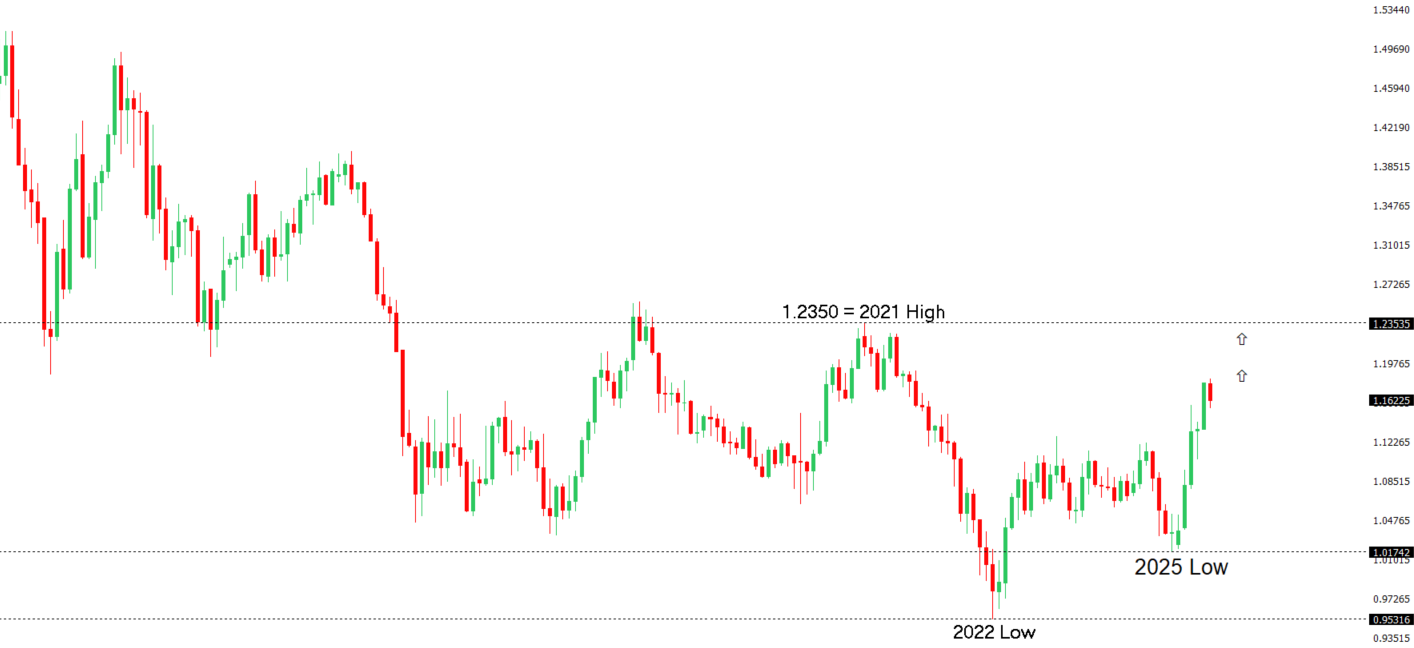
The Euro has finally broken out from a multi-month consolidation off a critical longer-term low. This latest push through the 2023 high lends further support to the case for a meaningful bottom, setting the stage for a bullish structural shift and the next major upside extension targeting the 2021 high at 1.2350. Setbacks should be exceptionally well supported below 1.1000.

EURUSD Chart
R2 1.1632 - 12 June/2025 high - Strong
R1 1.1600 - Figure - Medium
S1 1.1373 - 10 June low - Medium
S2 1.1210 - 29 May low - Strong
EURUSD: fundamental overview

Since the ECB’s June rate cut, policymakers are cautiously maintaining the current 2% interest rate, with Eurozone markets expecting just one more cut in 2025, while US markets anticipate two, supporting the euro’s strength. The EU is boosting defense capabilities by streamlining regulations, aiming to speed up defense project approvals to 60 days, which could positively impact the euro. ECB President Lagarde is advocating for reforms to position the euro as a stronger alternative to the dollar, while recent German economic data, including a strong ZEW Survey Expectations score of 47.5, signals growing confidence and potential recovery from nearly three years of stagnation.

 
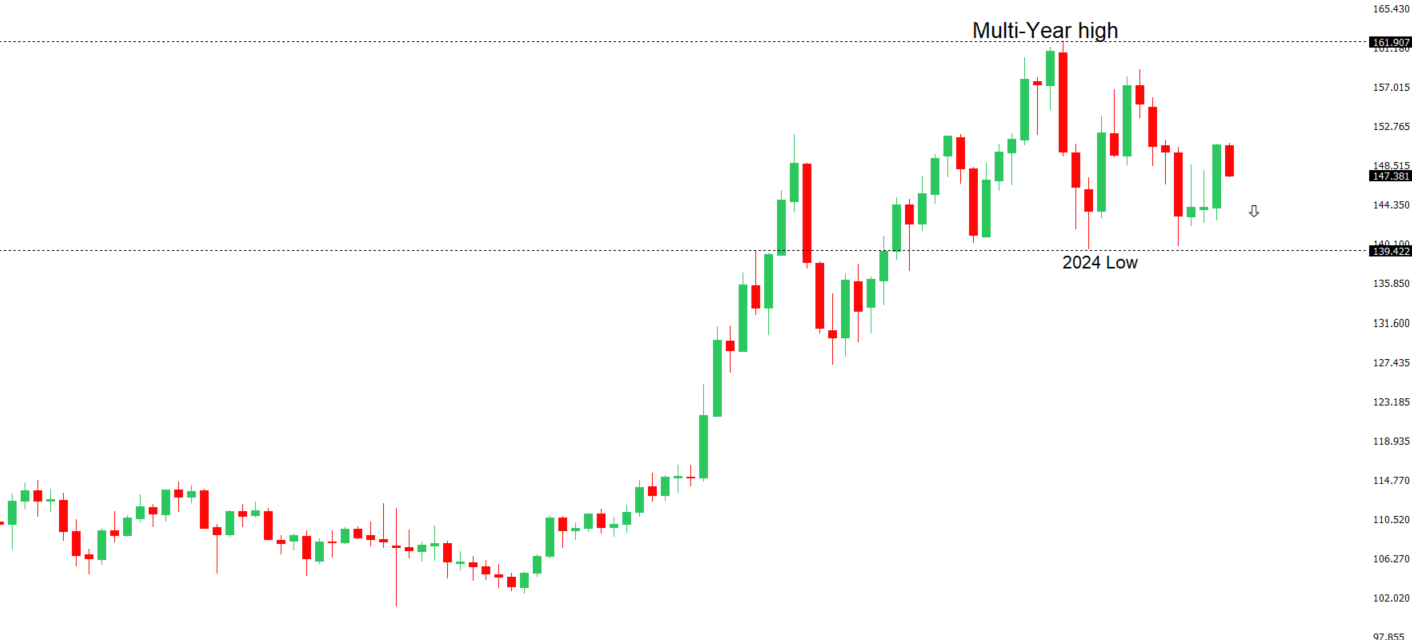
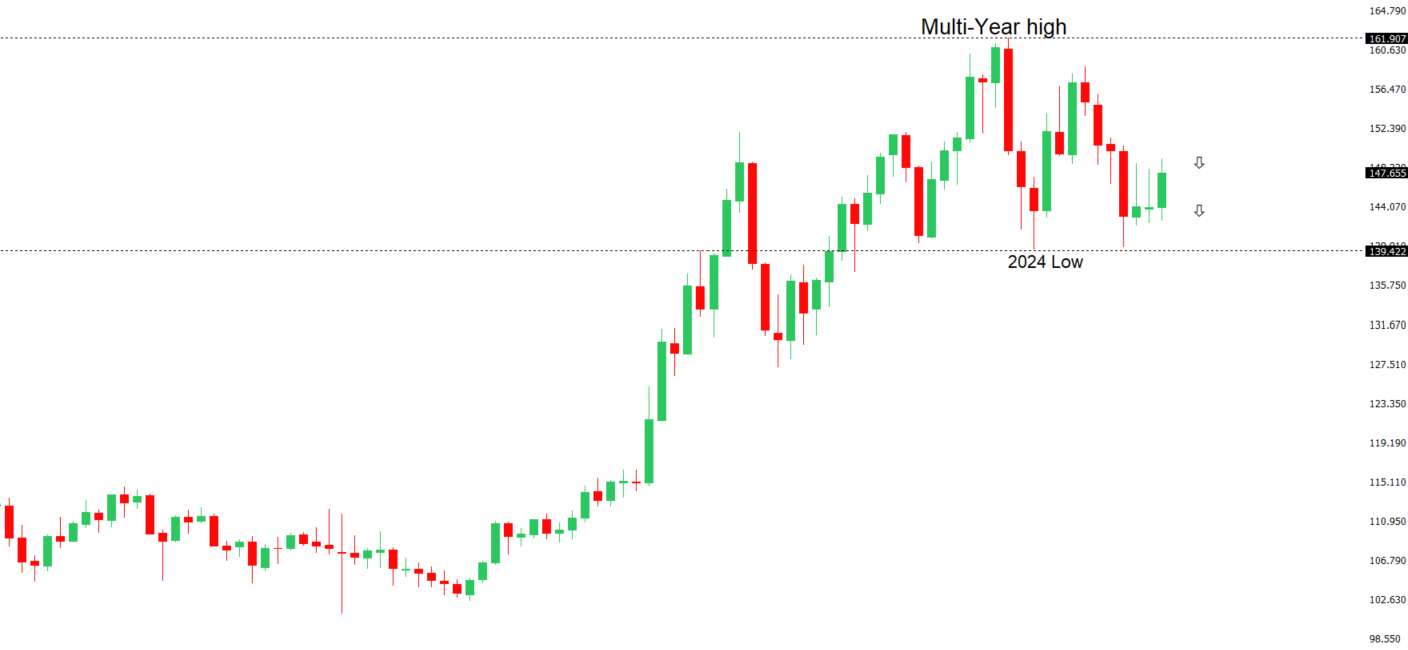
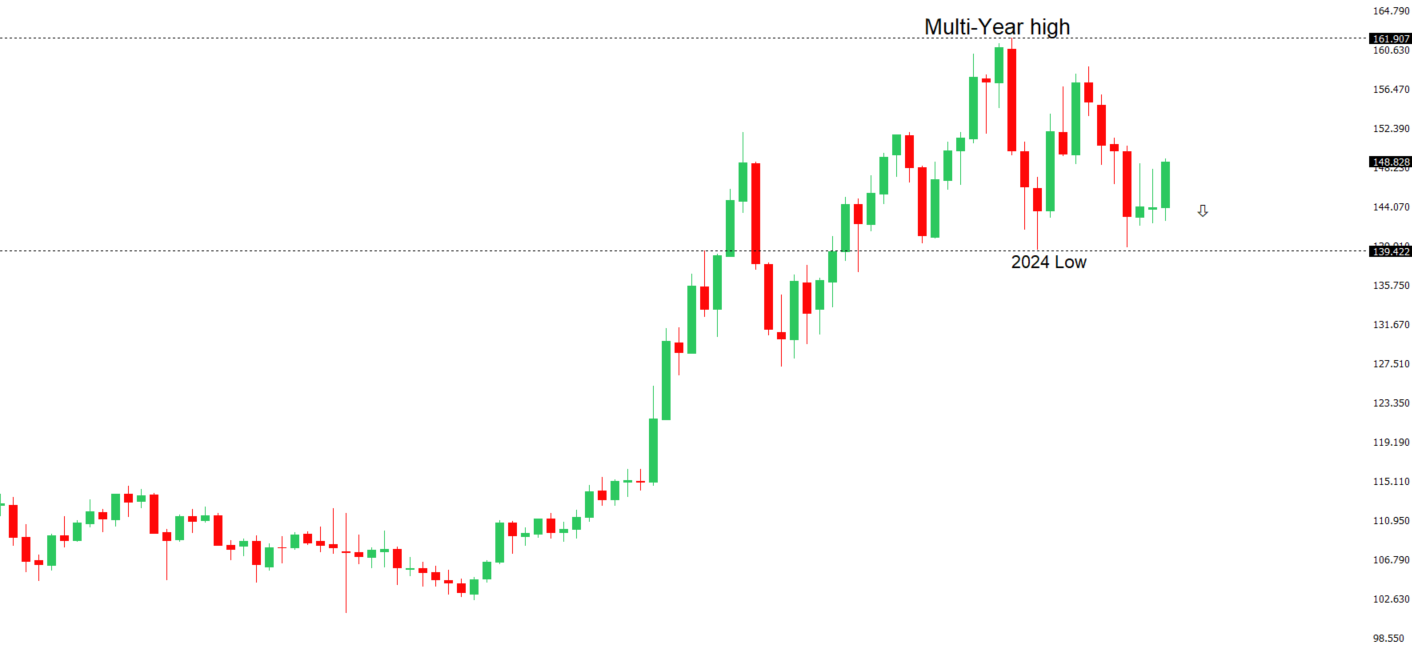
USDJPY: technical overview

There are signs of a meaningful top in place after the market put in a multi-year high in 2024. At this point, the door is now open for a deeper setback below the 2024 low at 139.58 over the coming sessions exposing a retest of the 2023 low. Rallies should be well capped below 150.00.

USDJPY Chart
R2 148.65 - 12 May high - Medium
R1 146.29 - 29 May high - Medium
S1 142.11 - 27 May low - Medium
S2 141.97 - 29 April low - Medium
USDJPY: fundamental overview

The Bank of Japan maintained its target rate at 0.50% and announced a gradual reduction in Japanese Government Bond purchases starting April 2026, aiming for ¥2 trillion by March 2027, with flexibility to adjust based on market conditions. While signaling openness to future rate hikes if inflation and economic conditions improve, BOJ Governor Ueda noted the yen’s weakness is increasingly driving domestic inflation, which remains above the 2% target. Rising oil prices, partly due to the Israel-Iran conflict, could further push inflation, potentially forcing tighter policy. Japan’s economy faces challenges from a widening trade deficit (-¥637.6bn in May) and a -1.7% drop in exports, raising recession risks amid ongoing US-Japan trade talks and US tariffs.

 
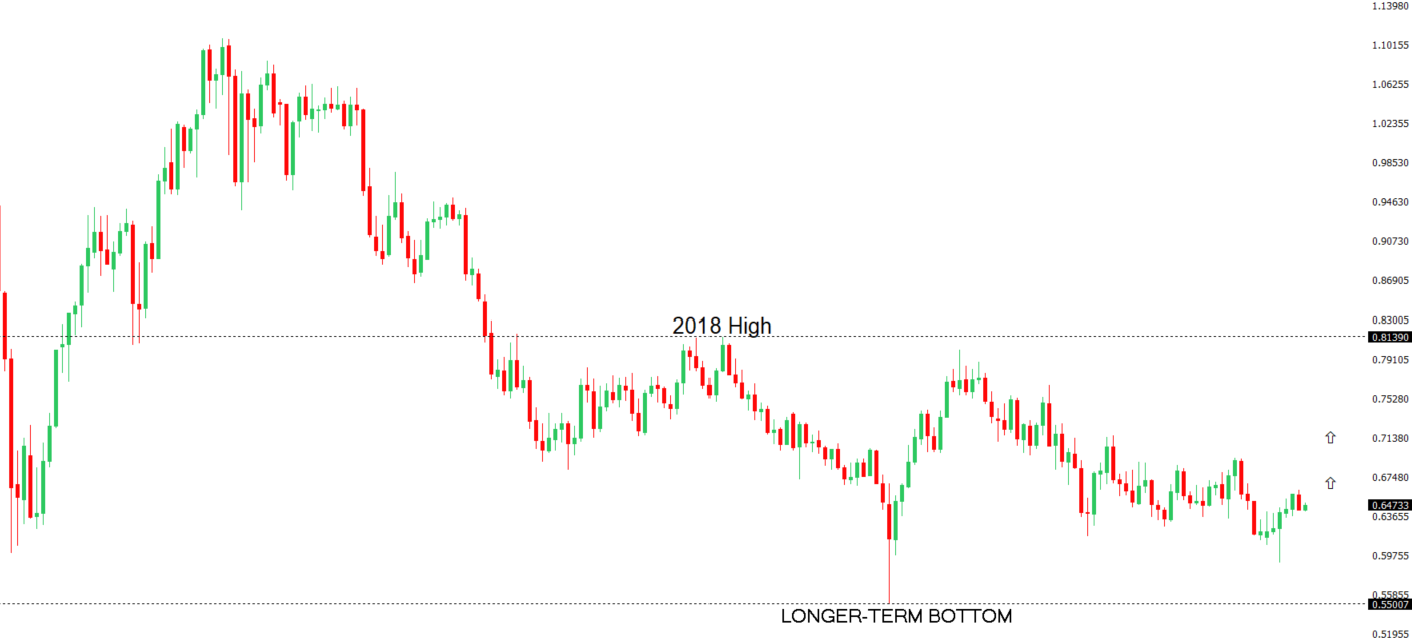
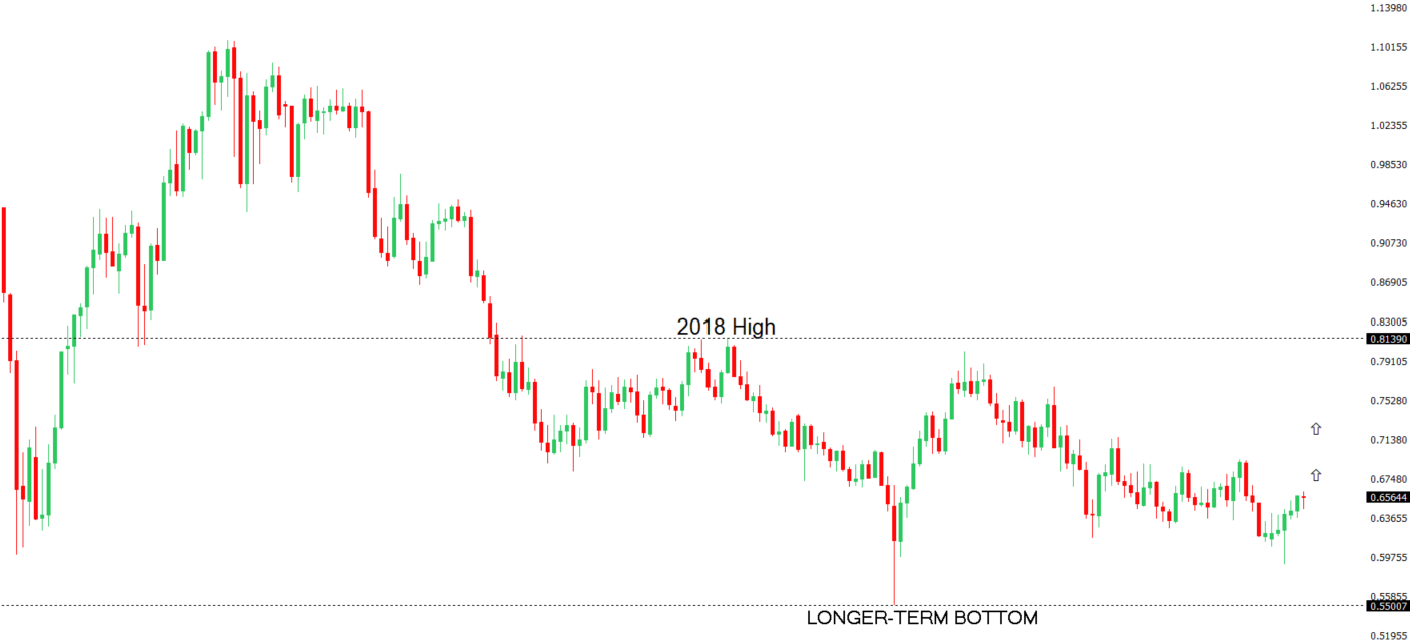
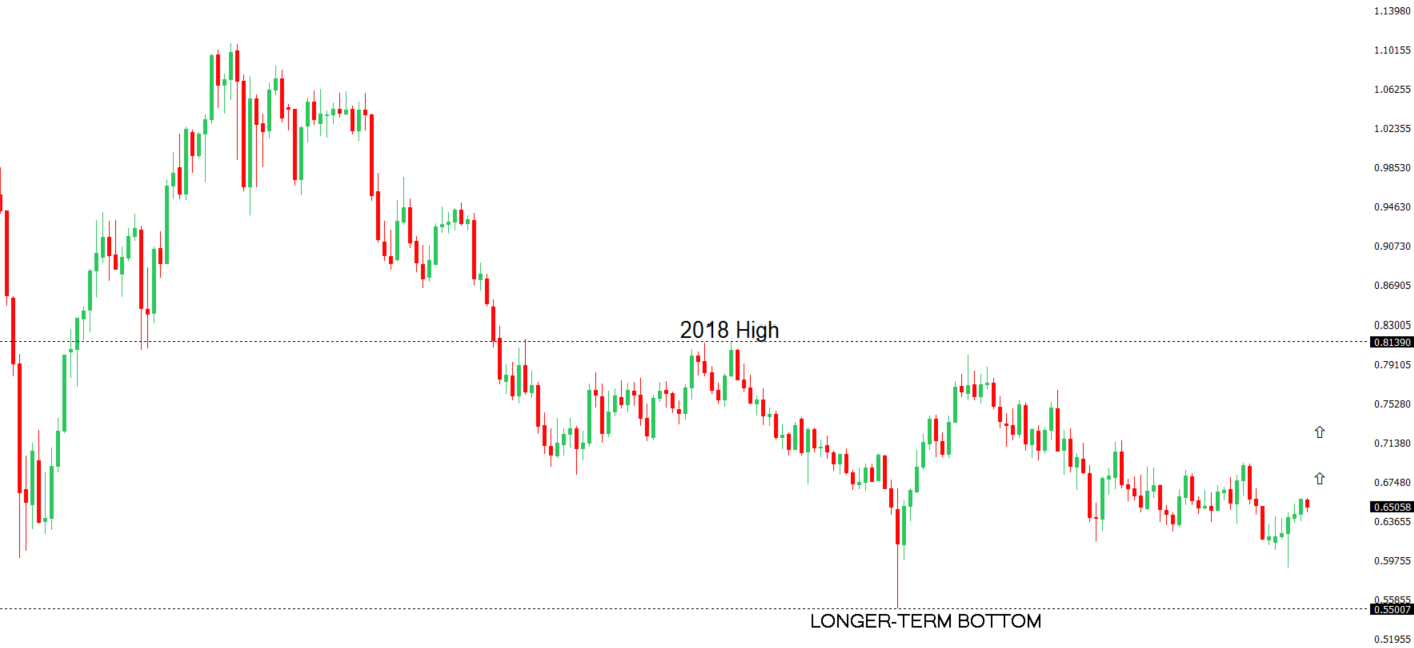
AUDUSD: technical overview

There are signs of the potential formation of a longer-term base with the market trading down into a meaningful longer-term support zone. Only a monthly close below 0.5500 would give reason for rethink. A monthly close back above 0.7000 will take the big picture pressure off the downside and strengthen case for a bottom.

AUDUSD Chart
R2 0.6550 - 25 November 2024 high - Strong
R1 0.6546 - 11 June/2025 high - Medium
S1 0.6344 - 24 April low - Medium
S1 0.6275 - 14 April low - Strong
AUDUSD: fundamental overview

The Australian Dollar uptrend remains intact despite a rejection at the 61.8% retrace level, driven by Middle East tensions, with potential for resumed growth if the conflict cools and focus shifts to U.S. fiscal concerns. Positive Chinese economic data and optimism around U.S.-China trade talks are supporting the Australian dollar, alongside a $187.2 billion takeover bid for Santos by an Abu Dhabi-led consortium, though a regulatory block could cause a temporary dip. Recent Australian data indicates below-trend economic growth, influenced by both global and domestic factors.

 
Suggested reading

Israel/Iran Is a Mere Bump On the Way to S&P 500 7,000, J. Sonenshine, Barron’s (June 13, 2025)

Gold Is Signaling Skepticism About the Future, J. Calhoun, Alhambra (June 15, 2025)


Any opinions, news, research, analyses, prices or other information ("information") contained on this Blog, constitutes marketing communication and it has not been prepared in accordance with legal requirements designed to promote the independence of investment research. Further, the information contained within this Blog does not contain (and should not be construed as containing) investment advice or an investment recommendation, or an offer of, or solicitation for, a transaction in any financial instrument. LMAX Group has not verified the accuracy or basis-in-fact of any claim or statement made by any third parties as comments for every Blog entry.

LMAX Group will not accept liability for any loss or damage, including without limitation to, any loss of profit, which may arise directly or indirectly from use of or reliance on such information. No representation or warranty is given as to the accuracy or completeness of the above information. While the produced information was obtained from sources deemed to be reliable, LMAX Group does not provide any guarantees about the reliability of such sources. Consequently any person acting on it does so entirely at his or her own risk. It is not a place to slander, use unacceptable language or to promote LMAX Group or any other FX and CFD provider and any such postings, excessive or unjust comments and attacks will not be allowed and will be removed from the site immediately.

Day Image
17th June 2025 | view in browser
Treasury yields steady, Fed meeting looms

The U.S. dollar continues to get sold into rallies despite escalating Middle East tensions, including Israeli airstrikes and President Trump’s call for Tehran’s evacuation. U.S. stock futures have dipped only slightly after Monday’s strong gains across major indexes led by tech and consumer stocks.


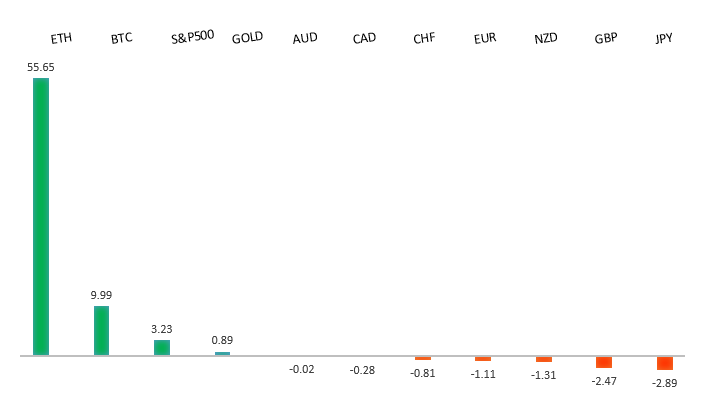
Performance chart 30day v. USD (%)
Performance Chart
 
 
Technical & fundamental highlights
EURUSD: technical overview

The Euro has finally broken out from a multi-month consolidation off a critical longer-term low. This latest push through the 2023 high lends further support to the case for a meaningful bottom, setting the stage for a bullish structural shift and the next major upside extension targeting the 2021 high at 1.2350. Setbacks should be exceptionally well supported below 1.1000.

EURUSD Chart
R2 1.1632 - 12 June/2025 high - Strong
R1 1.1600 - Figure - Medium
S1 1.1373 - 10 June low - Medium
S2 1.1210 - 29 May low - Strong
EURUSD: fundamental overview

The euro remains strong despite global tensions, including reported missile strikes in Israel, as markets stay calm and the ECB downplays concerns about the euro’s value near 1.15. ECB officials express a cautious, balanced view on inflation and policy amid uncertainty, while attention turns to the upcoming Fed meeting, where no policy changes are expected but Powell’s comments will be closely watched. Key economic data releases include Sweden’s labor market figures and economic forecasts, Germany’s ZEW Survey for June, and speeches from ECB members Villeroy de Galhau and Centeno, which could shed light on future monetary policy.

 
USDJPY: technical overview

There are signs of a meaningful top in place after the market put in a multi-year high in 2024. At this point, the door is now open for a deeper setback below the 2024 low at 139.58 over the coming sessions exposing a retest of the 2023 low. Rallies should be well capped below 150.00.

USDJPY Chart
R2 148.65 - 12 May high - Medium
R1 146.29 - 29 May high - Medium
S1 142.11 - 27 May low - Medium
S2 141.97 - 29 April low - Medium
USDJPY: fundamental overview

The Japanese yen weakened toward 145 per dollar, declining for three days after the Bank of Japan kept its 0.5% interest rate and bond-buying plan unchanged, though it hinted at possible future adjustments. Despite no tariff deal between Prime Minister Ishiba and President Trump at the G7 summit, Japanese stocks rose, with the Nikkei 225 up 0.5% and tech stocks like Disco and Lasertec leading gains. The BOJ continues its cautious policy, planning gradual reductions in bond purchases through 2027, while monitoring global risks like rising oil prices and U.S. trade policies.

 
AUDUSD: technical overview

There are signs of the potential formation of a longer-term base with the market trading down into a meaningful longer-term support zone. Only a monthly close below 0.5500 would give reason for rethink. A monthly close back above 0.7000 will take the big picture pressure off the downside and strengthen case for a bottom.

AUDUSD Chart
R2 0.6550 - 25 November 2024 high - Strong
R1 0.6546 - 11 June/2025 high - Medium
S1 0.6344 - 24 April low - Medium
S1 0.6275 - 14 April low - Strong
AUDUSD: fundamental overview

The Australian dollar dipped to about $0.65 as Middle East tensions, fueled by Israel’s intensified airstrikes and Trump’s call for Tehran evacuations, unsettled markets, though Iran’s interest in nuclear talks offered some hope. Australian bond yields fell to 4.24%, near six-week lows, with investors cautious ahead of a key jobs report that could impact expectations for a July rate cut, currently seen as 75% likely. The ASX 200 stayed flat at 8,549, supported by stable oil production and gains in stocks like Newmont (up 3.8%) and Block Inc. (up 3.4%). The Reserve Bank of Australia is expected to cut rates by a quarter point to 3.60% on July 8, marking its third cut this year, while also planning to disclose divided member votes.

 
Suggested reading

This Week’s Fed Meeting Won’t Be Market Accelerator, V. Chen, MarketWatch (June 15, 2025)

A Few Pieces of Very Bad Advice, M. Housel, Collaborative Fund (June 12, 2025)


Any opinions, news, research, analyses, prices or other information ("information") contained on this Blog, constitutes marketing communication and it has not been prepared in accordance with legal requirements designed to promote the independence of investment research. Further, the information contained within this Blog does not contain (and should not be construed as containing) investment advice or an investment recommendation, or an offer of, or solicitation for, a transaction in any financial instrument. LMAX Group has not verified the accuracy or basis-in-fact of any claim or statement made by any third parties as comments for every Blog entry.

LMAX Group will not accept liability for any loss or damage, including without limitation to, any loss of profit, which may arise directly or indirectly from use of or reliance on such information. No representation or warranty is given as to the accuracy or completeness of the above information. While the produced information was obtained from sources deemed to be reliable, LMAX Group does not provide any guarantees about the reliability of such sources. Consequently any person acting on it does so entirely at his or her own risk. It is not a place to slander, use unacceptable language or to promote LMAX Group or any other FX and CFD provider and any such postings, excessive or unjust comments and attacks will not be allowed and will be removed from the site immediately.

Day Image
16th June 2025 | view in browser
Geopolitics driving dollar, oil prices

The U.S. dollar remains steady but slightly stronger against risk-sensitive currencies as tensions between Israel and Iran escalate, with no signs of de-escalation after four days of strikes.


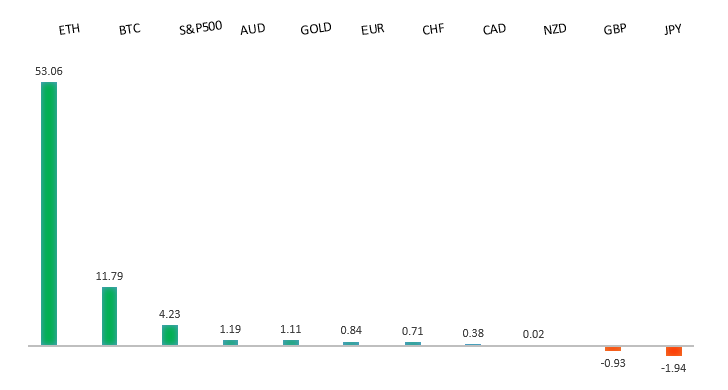
Performance chart 30day v. USD (%)
Performance Chart
 
 
Technical & fundamental highlights
EURUSD: technical overview

The Euro has finally broken out from a multi-month consolidation off a critical longer-term low. This latest push through the 2023 high lends further support to the case for a meaningful bottom, setting the stage for a bullish structural shift and the next major upside extension targeting the 2021 high at 1.2350. Setbacks should be exceptionally well supported below 1.1000.

EURUSD Chart
R2 1.1632 - 12 June/2025 high - Strong
R1 1.1600 - Figure - Medium
S1 1.1373 - 10 June low - Medium
S2 1.1210 - 29 May low - Strong
EURUSD: fundamental overview

Central bank policies are creating mixed effects on currencies. The European Central Bank is pausing its easing measures to assess the impact of potential new US tariffs, while softer US inflation and trade tensions are weakening the dollar, with markets expecting Federal Reserve rate cuts possibly in September. Despite a recent euro boost from these differences, geopolitical concerns are now dominating, with markets anticipating one more 25-basis-point rate cut by the ECB before year-end, most likely in December.

 
USDJPY: technical overview

There are signs of a meaningful top in place after the market put in a multi-year high in 2024. At this point, the door is now open for a deeper setback below the 2024 low at 139.58 over the coming sessions exposing a retest of the 2023 low. Rallies should be well capped below 150.00.

USDJPY Chart
R2 148.65 - 12 May high - Medium
R1 146.29 - 29 May high - Medium
S1 142.11 - 27 May low - Medium
S2 141.97 - 29 April low - Medium
USDJPY: fundamental overview

The yen weakened as traders favored the dollar amid escalating tensions between Israel and Iran, who attacked each other’s oil and gas facilities, driving up crude prices and complicating global inflation. Japanese bond yields rose to 1.44%, but the Bank of Japan is unlikely to raise rates at its upcoming meeting, with Governor Ueda emphasizing a wait-and-see approach until inflation nears 2%. Despite global uncertainties, Japanese stocks, particularly tech, rose with the Nikkei up 1% and Topix up 0.6%, as investors focused more on BOJ policy than Middle East conflicts.

 
AUDUSD: technical overview

There are signs of the potential formation of a longer-term base with the market trading down into a meaningful longer-term support zone. Only a monthly close below 0.5500 would give reason for rethink. A monthly close back above 0.7000 will take the big picture pressure off the downside and strengthen case for a bottom.

AUDUSD Chart
R2 0.6550 - 25 November 2024 high - Strong
R1 0.6546 - 11 June/2025 high - Medium
S1 0.6344 - 24 April low - Medium
S1 0.6275 - 14 April low - Strong
AUDUSD: fundamental overview

China’s property market is showing slight improvement, with home prices falling 3.5% in May, the smallest decline since April 2024, offering some support for the Australian Dollar due to Australia’s iron ore exports. However, weaker factory output (5.8% growth) and a sharp 10.7% drop in real estate investment limit the Aussie’s gains. Strong retail sales (6.4%) and steady unemployment (5%) in China provide a positive backdrop, but the mixed economic signals keep the Australian Dollar’s rally in check.

 
Suggested reading

A Market Perspective on Israel and Iran’s Conflict, Fisher Investments (June 13, 2025)

Reserving Judgment On The Gold Rally, T. Nangle, FT Alphaville (June 12, 2025)


Any opinions, news, research, analyses, prices or other information ("information") contained on this Blog, constitutes marketing communication and it has not been prepared in accordance with legal requirements designed to promote the independence of investment research. Further, the information contained within this Blog does not contain (and should not be construed as containing) investment advice or an investment recommendation, or an offer of, or solicitation for, a transaction in any financial instrument. LMAX Group has not verified the accuracy or basis-in-fact of any claim or statement made by any third parties as comments for every Blog entry.

LMAX Group will not accept liability for any loss or damage, including without limitation to, any loss of profit, which may arise directly or indirectly from use of or reliance on such information. No representation or warranty is given as to the accuracy or completeness of the above information. While the produced information was obtained from sources deemed to be reliable, LMAX Group does not provide any guarantees about the reliability of such sources. Consequently any person acting on it does so entirely at his or her own risk. It is not a place to slander, use unacceptable language or to promote LMAX Group or any other FX and CFD provider and any such postings, excessive or unjust comments and attacks will not be allowed and will be removed from the site immediately.

Day Image
13th June 2025 | view in browser
Israel-Iran clash triggers investor panic

A surprise Israeli airstrike on Iranian nuclear facilities has rattled global markets, sending global equities lower as investors flock to safe-haven assets. Amid this turmoil, attention is also on the upcoming University of Michigan consumer sentiment report.


Performance chart 30day v. USD (%)
Performance Chart
 
 
Technical & fundamental highlights
EURUSD: technical overview

The Euro has finally broken out from a multi-month consolidation off a critical longer-term low. This latest push through the 2023 high lends further support to the case for a meaningful bottom, setting the stage for a bullish structural shift and the next major upside extension targeting the 2021 high at 1.2350. Setbacks should be exceptionally well supported below 1.1000.

EURUSD Chart
R2 1.1632 - 12 June/2025 high - Strong
R1 1.1600 - Figure - Medium
S1 1.1373 - 10 June low - Medium
S2 1.1210 - 29 May low - Strong
EURUSD: fundamental overview

The euro paused its four-day rise, shifting to retreat mode as Middle East tensions boosted demand for the US dollar. However, the dollar’s gains may be capped by President Trump’s expanded steel tariffs on household appliances and lower-than-expected CPI and PPI reports, which support expectations for Federal Reserve rate cuts. Investors are now focused on upcoming CPI data from Europe, an ECB speech, and the Michigan Consumer Sentiment report for further economic insights.

 
USDJPY: technical overview

There are signs of a meaningful top in place after the market put in a multi-year high in 2024. At this point, the door is now open for a deeper setback below the 2024 low at 139.58 over the coming sessions exposing a retest of the 2023 low. Rallies should be well capped below 150.00.

USDJPY Chart
R2 148.65 - 12 May high - Medium
R1 146.29 - 29 May high - Medium
S1 142.11 - 27 May low - Medium
S2 141.97 - 29 April low - Medium
USDJPY: fundamental overview

The yen initially surged against the dollar following news of an Israeli attack, with its safe-haven status bolstered by geopolitical tensions and potential Iranian retaliation. President Trump’s tariff threats add to market uncertainty, further supporting the yen and driving Japanese bond yields lower, with the 10-year yield hitting 1.4%. Japanese stock indices, Nikkei 225 and Topix, fell over 1%, reflecting broader market unease, while BOJ Governor Ueda maintained a hawkish stance, signaling potential rate hikes if inflation neared 2%.

 
AUDUSD: technical overview

There are signs of the potential formation of a longer-term base with the market trading down into a meaningful longer-term support zone. Only a monthly close below 0.5500 would give reason for rethink. A monthly close back above 0.7000 will take the big picture pressure off the downside and strengthen case for a bottom.

AUDUSD Chart
R2 0.6550 - 25 November 2024 high - Strong
R1 0.6546 - 11 June/2025 high - Medium
S1 0.6344 - 24 April low - Medium
S1 0.6275 - 14 April low - Strong
AUDUSD: fundamental overview

Financial markets in Australia faced significant turmoil today following Israel’s unexpected attack on Iranian nuclear sites, prompting a widespread sell-off of risky assets. The Australian dollar plummeted, erasing recent gains, as fears of Iranian retaliation and escalating Middle East tensions gripped investors. Adding to the uncertainty, renewed U.S. tariff threats under Trump, including a proposed 50% steel duty hike by June 23, further rattled Australia’s export-driven economy. In response, investors sought safety, driving 10-year ACGB yields down to the lowest levels since May. Compounding the unease, weak GDP data and speculation of an 80% chance of an RBA rate cut next month, potentially lowering rates to 3.10% by year-end, signal a rapidly cooling economy.

 
Suggested reading

The Resurgence of Do It Yourself Economics, I. Murray, The Daily Economy (June 12, 2025)

Check Your Political Brain When Putting Your Money To Work, J. Hough, Barron’s (June 6, 2025)


Any opinions, news, research, analyses, prices or other information ("information") contained on this Blog, constitutes marketing communication and it has not been prepared in accordance with legal requirements designed to promote the independence of investment research. Further, the information contained within this Blog does not contain (and should not be construed as containing) investment advice or an investment recommendation, or an offer of, or solicitation for, a transaction in any financial instrument. LMAX Group has not verified the accuracy or basis-in-fact of any claim or statement made by any third parties as comments for every Blog entry.

LMAX Group will not accept liability for any loss or damage, including without limitation to, any loss of profit, which may arise directly or indirectly from use of or reliance on such information. No representation or warranty is given as to the accuracy or completeness of the above information. While the produced information was obtained from sources deemed to be reliable, LMAX Group does not provide any guarantees about the reliability of such sources. Consequently any person acting on it does so entirely at his or her own risk. It is not a place to slander, use unacceptable language or to promote LMAX Group or any other FX and CFD provider and any such postings, excessive or unjust comments and attacks will not be allowed and will be removed from the site immediately.

Day Image
12th June 2025 | view in browser
Fed cuts loom as markets wobble

Global markets are jittery as President Trump intensifies trade negotiations, announcing plans to send formal letters to trading partners within two weeks outlining unilateral tariffs ahead of the July 9 deadline, though Treasury Secretary Scott Bessent suggests a possible extension of the current tariff pause for countries negotiating in good faith.


Performance chart 30day v. USD (%)
Performance Chart
 
 
Technical & fundamental highlights
EURUSD: technical overview

The Euro has finally broken out from a multi-month consolidation off a critical longer-term low. This latest push through the 2023 high lends further support to the case for a meaningful bottom, setting the stage for a bullish structural shift and the next major upside extension targeting the 2021 high at 1.2350. Setbacks should be exceptionally well supported below 1.1000.

EURUSD Chart
R2 1.1574 - 21 April/2025 high - Strong
R1 1.1530 - 12 June high - Medium
S1 1.1373 - 10 June low - Medium
S2 1.1210 - 29 May low - Strong
EURUSD: fundamental overview

Global investors puled $24.7 billion out of US equities in May—the largest outflow in a year—shifting focus to European and emerging markets due to concerns over US fiscal policy, rising debt, and potential trade tariffs sparking a recession, according to LSEG Lipper data. European funds saw $21 billion in inflows last month, totaling $82.5 billion this year, boosted by lower interest rates and Germany’s $1 trillion stimulus, while emerging market ETFs attracted $3.6 billion, pushing yearly inflows to $11.1 billion. The dollar’s weakening and US Treasury sell-offs are driving this trend, with the euro nearing April’s high and looking to keep pushing, as ECB policy and fading US safe-haven appeal fuel optimism for further gains.

 
USDJPY: technical overview

There are signs of a meaningful top in place after the market put in a multi-year high in 2024. At this point, the door is now open for a deeper setback below the 2024 low at 139.58 over the coming sessions exposing a retest of the 2023 low. Rallies should be well capped below 150.00.

USDJPY Chart
R2 148.65 - 12 May high - Medium
R1 146.29 - 29 May high - Medium
S1 142.11 - 27 May low - Medium
S2 141.97 - 29 April low - Medium
USDJPY: fundamental overview

Japan’s economic outlook has worsened, with the Business Survey Index for large manufacturers dropping to -4.8% in Q2 2025 from -2.4% in Q1, falling short of the expected 0.8% rebound and hitting the lowest level since early 2024, largely due to US trade barriers impacting its export-driven economy. Despite the current downturn, manufacturers are hopeful for a recovery, forecasting a rise to 5.7% in Q3 and 8.4% in Q4, though ongoing trade tensions with the Trump administration—marked by a 10% tariff on Japanese goods—could alter these projections. The yen gained as a safe-haven asset after Trump’s tariff threats, while the Nikkei 225 slipped 0.7% to 38,149, and the 10-year JGB yield fell to 1.45%, amid a complex policy stance from the BOJ, which may raise rates if inflation nears 2%.

 
AUDUSD: technical overview

There are signs of the potential formation of a longer-term base with the market trading down into a meaningful longer-term support zone. Only a monthly close below 0.5500 would give reason for rethink. A monthly close back above 0.7000 will take the big picture pressure off the downside and strengthen case for a bottom.

AUDUSD Chart
R2 0.6550 - 25 November 2024 high - Strong
R1 0.6546 - 11 June/2025 high - Medium
S1 0.6344 - 24 April low - Medium
S1 0.6275 - 14 April low - Strong
AUDUSD: fundamental overview

The Australian dollar is under pressure as inflation expectations soar to 5.0% in June from 4.1% in May—the highest since mid-2023—creating a stark contrast with the official 2.4% rate and complicating the Reserve Bank of Australia’s strategy. With fading energy subsidies, tight labor markets, and supply issues likely pushing inflation toward the upper end of the 2-3% target, the Aussie is fluctuating, despite an 82% market expectation of a July rate cut and 77 basis points of cuts by December. If rising inflation fears prompt the RBA to reconsider these cuts, the Australian dollar might see a short-term boost.

 
Suggested reading

Different Kinds of Smart, M. Housel, Collaborative Fund (June 11, 2025)

20 Stocks To Avoid No Matter What The Market Does, M. Hulbert, MarketWatch (June 11, 2025)


Any opinions, news, research, analyses, prices or other information ("information") contained on this Blog, constitutes marketing communication and it has not been prepared in accordance with legal requirements designed to promote the independence of investment research. Further, the information contained within this Blog does not contain (and should not be construed as containing) investment advice or an investment recommendation, or an offer of, or solicitation for, a transaction in any financial instrument. LMAX Group has not verified the accuracy or basis-in-fact of any claim or statement made by any third parties as comments for every Blog entry.

LMAX Group will not accept liability for any loss or damage, including without limitation to, any loss of profit, which may arise directly or indirectly from use of or reliance on such information. No representation or warranty is given as to the accuracy or completeness of the above information. While the produced information was obtained from sources deemed to be reliable, LMAX Group does not provide any guarantees about the reliability of such sources. Consequently any person acting on it does so entirely at his or her own risk. It is not a place to slander, use unacceptable language or to promote LMAX Group or any other FX and CFD provider and any such postings, excessive or unjust comments and attacks will not be allowed and will be removed from the site immediately.

Day Image
11th June 2025 | view in browser
Markets eye US CPI amid global trade optimism

The US dollar holds firm as markets await the May US CPI data and the third round of US-China trade talks in London, with cautious optimism stemming from progress on resolving China’s rare earth export restrictions and potential US tech export relief, though concerns linger over Trump’s trade and fiscal policies.


Performance chart 30day v. USD (%)
Performance Chart
 
 
Technical & fundamental highlights
EURUSD: technical overview

The Euro has finally broken out from a multi-month consolidation off a critical longer-term low. This latest push through the 2023 high lends further support to the case for a meaningful bottom, setting the stage for a bullish structural shift and the next major upside extension targeting the 2021 high at 1.2350. Setbacks should be exceptionally well supported below 1.1000.

EURUSD Chart
R2 1.1574 - 21 April/2025 high - Strong
R1 1.1495 - 5 June high - Medium
S1 1.1210 - 29 May low - Medium
S2 1.1065 - 12 May low - Strong
EURUSD: fundamental overview

The eurozone economy is recovering, with 0.6% growth in Q1 2025 and inflation at the ECB’s 2% target, following the ECB’s eighth consecutive rate cut, lowering the deposit rate to 2%. ECB President Christine Lagarde indicated the easing cycle may be nearing its end, while officials like François Villeroy de Galhau see policy as “normalized” but flexible, though Robert Holzmann expects steady rates through summer and Boris Vujcic awaits clearer economic and US tariff data by September. Amid global trade uncertainties, ECB members like Isabel Schnabel and Yannis Stournaras see a chance to boost the euro’s international role as a safe-haven asset, with upcoming speeches from Lagarde, Lane, and Cipollone expected to clarify ECB policy direction.

 
USDJPY: technical overview

There are signs of a meaningful top in place after the market put in a multi-year high in 2024. At this point, the door is now open for a deeper setback below the 2024 low at 139.58 over the coming sessions exposing a retest of the 2023 low. Rallies should be well capped below 150.00.

USDJPY Chart
R2 148.65 - 12 May high - Medium
R1 146.29 - 29 May high - Medium
S1 142.11 - 27 May low - Medium
S2 141.97 - 29 April low - Medium
USDJPY: fundamental overview

The yen hit a two-week low as improved risk appetite reduced demand for safe-haven assets, while Japanese stocks rose, with the Nikkei up 0.4% and Topix up 0.2%, driven by tech gains from companies like Advantest (+3.2%), Lasertec (+3.4%), and Tokyo Electron (+2.6%), fueled by optimism over US-China trade talks. Inflation in Japan eased, with producer prices up 3.2% in May, but BOJ Governor Ueda maintained a hawkish stance, ready to raise rates if inflation nears 2%. Meanwhile, a selloff in Japanese government bonds, coupled with Japan’s 250% debt-to-GDP ratio, raises concerns for banks and insurers facing potential losses and credit rating risks.

 
AUDUSD: technical overview

There are signs of the potential formation of a longer-term base with the market trading down into a meaningful longer-term support zone. Only a monthly close below 0.5500 would give reason for rethink. A monthly close back above 0.7000 will take the big picture pressure off the downside and strengthen case for a bottom.

AUDUSD Chart
R2 0.6550 - 25 November 2024 high - Strong
R1 0.6539 - 5 June/2025 high - Medium
S1 0.6344 - 24 April low - Medium
S1 0.6275 - 14 April low - Strong
AUDUSD: fundamental overview

The Australian stock market rose on Wednesday, with the ASX 200 up 0.3% to a record high, buoyed by optimism over US-China trade talks despite weaker local currencies. Over 60% of stocks in both indices traded above their 200-day moving averages, reflecting strong market breadth. Weak Australian economic data, including 0.2% Q1 growth and declining consumer and business activity, has fueled concerns that the Reserve Bank of Australia may need to cut rates soon.

 
Suggested reading

Could the degrowth movement save our planet?, S. Keynes, Financial Times (June 10, 2025)

With Pause Soon to Expire, Where Are the Deals?, J. Calhoun, Alhambra Investments (June 8, 2025)


Any opinions, news, research, analyses, prices or other information ("information") contained on this Blog, constitutes marketing communication and it has not been prepared in accordance with legal requirements designed to promote the independence of investment research. Further, the information contained within this Blog does not contain (and should not be construed as containing) investment advice or an investment recommendation, or an offer of, or solicitation for, a transaction in any financial instrument. LMAX Group has not verified the accuracy or basis-in-fact of any claim or statement made by any third parties as comments for every Blog entry.

LMAX Group will not accept liability for any loss or damage, including without limitation to, any loss of profit, which may arise directly or indirectly from use of or reliance on such information. No representation or warranty is given as to the accuracy or completeness of the above information. While the produced information was obtained from sources deemed to be reliable, LMAX Group does not provide any guarantees about the reliability of such sources. Consequently any person acting on it does so entirely at his or her own risk. It is not a place to slander, use unacceptable language or to promote LMAX Group or any other FX and CFD provider and any such postings, excessive or unjust comments and attacks will not be allowed and will be removed from the site immediately.

Day Image
10th June 2025 | view in browser
Markets eye US CPI, trade talks for direction

The U.S. dollar hovered near its lowest levels since April, despite a slight rebound, as markets focused on ongoing U.S.-China trade talks in London, described as “good” and “fruitful” by Treasury Secretary Scott Bessent and Commerce Secretary Howard Lutnick, though geopolitical tensions in the Russia-Ukraine and Israel-Iran conflicts kept investors cautious.


Performance chart 30day v. USD (%)
Performance Chart
 
 
Technical & fundamental highlights
EURUSD: technical overview

The Euro has finally broken out from a multi-month consolidation off a critical longer-term low. This latest push through the 2023 high lends further support to the case for a meaningful bottom, setting the stage for a bullish structural shift and the next major upside extension targeting the 2021 high at 1.2350. Setbacks should be exceptionally well supported below 1.1000.

EURUSD Chart
R2 1.1574 - 21 April/2025 high - Strong
R1 1.1495 - 5 June high - Medium
S1 1.1210 - 29 May low - Medium
S2 1.1065 - 12 May low - Strong
EURUSD: fundamental overview

The euro gained momentum as US-China trade talks in London continued, focusing on rare-earth minerals and tech exports, while investors awaited speeches from ECB officials, including Francois Villeroy de Galhau, Robert Holzmann, and Olli Rehn, on monetary policy and trade uncertainties. The ECB’s recent 25-basis-point rate cut and lowered inflation forecasts signal easing price pressures, though hints of a nearing end to rate cuts bolstered the euro, despite money markets expecting one more cut by year-end. European bond yields dipped, with Germany’s 10-year Bund at 2.51%, and stocks remained flat, though chipmaker Alphawave soared 20% on Qualcomm’s $2.4 billion acquisition, and Spectris jumped 60% amid takeover talks. Persistent euro selling by central banks and sovereign funds, as noted by Bank of America, tempers gains, but a shift toward de-dollarization could strengthen the euro, while upcoming UK labor data and euro-area sentiment indicators, expected to improve slightly to -5.5, highlight ongoing economic concerns.

 
USDJPY: technical overview

There are signs of a meaningful top in place after the market put in a multi-year high in 2024. At this point, the door is now open for a deeper setback below the 2024 low at 139.58 over the coming sessions exposing a retest of the 2023 low. Rallies should be well capped below 150.00.

USDJPY Chart
R2 148.65 - 12 May high - Medium
R1 146.29 - 29 May high - Medium
S1 142.11 - 27 May low - Medium
S2 141.97 - 29 April low - Medium
USDJPY: fundamental overview

Japan’s Q1 GDP was revised to flat growth, better than the initially reported 0.2% contraction but slower than Q4 2024’s 0.6% expansion, boosting the Nikkei 225 by 0.92% to 38,088 and the Topix by 0.58% to 2,785, led by tech stocks. The 10-year JGB yield rose above 1.47% as BOJ Governor Kazuo Ueda signaled potential rate hikes and continued bond purchase tapering, with speculation of a slower tapering pace at next week’s meeting possibly pushing short-term yields higher. Positive US-China trade developments, including China’s approval of rare earth exports and Boeing’s resumed jet deliveries, further lifted investor sentiment as trade talks in London continued.

 
AUDUSD: technical overview

There are signs of the potential formation of a longer-term base with the market trading down into a meaningful longer-term support zone. Only a monthly close below 0.5500 would give reason for rethink. A monthly close back above 0.7000 will take the big picture pressure off the downside and strengthen case for a bottom.

AUDUSD Chart
R2 0.6550 - 25 November 2024 high - Strong
R1 0.6539 - 5 June/2025 high - Medium
S1 0.6344 - 24 April low - Medium
S1 0.6275 - 14 April low - Strong
AUDUSD: fundamental overview

The Australian dollar extended Monday’s 0.3% gain, trading near 0.6520, up 2.28% over the past month and 5.32% year-to-date, with momentum suggesting a push past resistance at 0.6550 toward last November’s high of 0.6688, supported by a floor at 0.6479. Optimism from ongoing US-China trade talks in London, led by U.S. Treasury Secretary Scott Bessent and China’s Vice Premier He Lifeng, has boosted risk appetite, though China’s persistent deflation, with consumer prices falling for a fourth month and producer prices dropping sharply, raises concerns for Australia’s economy. Australia’s 10-year ACGB yield climbed above 4.3%, reflecting improved market sentiment, but RBA Assistant Governor Sarah Hunter warned that U.S. tariffs could hamper growth, potentially necessitating further policy support, with a 75-basis-point rate cut priced in by year-end and an 82% chance of a 25-basis-point cut in July.

 
Suggested reading

What’s Harder? Planning Rates, or Harvard’s Class Of 2029?, J. Tamny, Forbes (June 8, 2025)

A Chart That Vivifies the Beginning of an AI Stock Boom, L. Lango, InvestorPlace (June 7, 2025)


Any opinions, news, research, analyses, prices or other information ("information") contained on this Blog, constitutes marketing communication and it has not been prepared in accordance with legal requirements designed to promote the independence of investment research. Further, the information contained within this Blog does not contain (and should not be construed as containing) investment advice or an investment recommendation, or an offer of, or solicitation for, a transaction in any financial instrument. LMAX Group has not verified the accuracy or basis-in-fact of any claim or statement made by any third parties as comments for every Blog entry.

LMAX Group will not accept liability for any loss or damage, including without limitation to, any loss of profit, which may arise directly or indirectly from use of or reliance on such information. No representation or warranty is given as to the accuracy or completeness of the above information. While the produced information was obtained from sources deemed to be reliable, LMAX Group does not provide any guarantees about the reliability of such sources. Consequently any person acting on it does so entirely at his or her own risk. It is not a place to slander, use unacceptable language or to promote LMAX Group or any other FX and CFD provider and any such postings, excessive or unjust comments and attacks will not be allowed and will be removed from the site immediately.

Day Image
9th June 2025 | view in browser
Dollar dips as trade talks and data loom

The Buck has cooled off in the aftermath of Friday’s rally, as markets brace for a busy week of economic data and US-China trade talks in London.


Performance chart 30day v. USD (%)
Performance Chart
 
 
Technical & fundamental highlights
EURUSD: technical overview

The Euro has finally broken out from a multi-month consolidation off a critical longer-term low. This latest push through the 2023 high lends further support to the case for a meaningful bottom, setting the stage for a bullish structural shift and the next major upside extension targeting the 2021 high at 1.2350. Setbacks should be exceptionally well supported below 1.1000.

EURUSD Chart
R2 1.1574 - 21 April/2025 high - Strong
R1 1.1495 - 5 June high - Medium
S1 1.1210 - 29 May low - Medium
S2 1.1065 - 12 May low - Strong
EURUSD: fundamental overview

The Euro is performing steadily despite a stronger dollar following the NFP release, with markets now focusing on US-China trade talks in London, led by Treasury Secretary Scott Bessent, aimed at easing ongoing trade tensions. In Europe, ECB policymaker Yannis Stournaras announced a successful “soft landing” for the eurozone, signaling the end of the easing cycle, though both he and ECB President Christine Lagarde warned that potential US tariffs could threaten growth amid heightened economic uncertainty.

 
USDJPY: technical overview

There are signs of a meaningful top in place after the market put in a multi-year high in 2024. At this point, the door is now open for a deeper setback below the 2024 low at 139.58 over the coming sessions exposing a retest of the 2023 low. Rallies should be well capped below 150.00.

USDJPY Chart
R2 148.65 - 12 May high - Medium
R1 146.29 - 29 May high - Medium
S1 142.11 - 27 May low - Medium
S2 141.97 - 29 April low - Medium
USDJPY: fundamental overview

Japan’s economy showed resilience in Q1 2025, with revised figures indicating flat growth instead of the initially reported 0.2% contraction, though far from the 0.6% growth of late 2024. Trade significantly boosted GDP by 0.4 points, a sharp reversal from the earlier estimated 0.8-point drag, despite a 0.5% drop in exports and a 3% surge in imports, aided by a 90-day trade truce with the Trump administration. Household spending grew slightly by 0.1%, business investment rose 1.1%, but public spending fell 0.5%, signaling potential challenges unless private spending increases.

 
AUDUSD: technical overview

There are signs of the potential formation of a longer-term base with the market trading down into a meaningful longer-term support zone. Only a monthly close below 0.5500 would give reason for rethink. A monthly close back above 0.7000 will take the big picture pressure off the downside and strengthen case for a bottom.

AUDUSD Chart
R2 0.6550 - 25 November 2024 high - Strong
R1 0.6539 - 5 June/2025 high - Medium
S1 0.6344 - 24 April low - Medium
S1 0.6275 - 14 April low - Strong
AUDUSD: fundamental overview

China’s trade surplus surged to $103.2 billion in May, driven by a robust 4.8% rise in exports, but a worrying 3.4% drop in imports marked the fourth consecutive month of decline, signaling weak domestic demand that could hurt Australia. Consumer and producer prices continued to fall, with deflation deepening as food prices dropped sharply, though Chinese stocks rose slightly amid optimism over renewed US-China trade talks in London. Despite the grim data, the Australian Dollar gained, even as expectations grow for a significant 35-point rate cut in Australia due to economic concerns.

 
Suggested reading

Why Investors Lack a Theory of Everything, Buttonwood, The Economist (June 4, 2025)

A Weak Dollar Would Add To Tariff Inflation, D. Lachman, Barrons (June 6, 2025)


Any opinions, news, research, analyses, prices or other information ("information") contained on this Blog, constitutes marketing communication and it has not been prepared in accordance with legal requirements designed to promote the independence of investment research. Further, the information contained within this Blog does not contain (and should not be construed as containing) investment advice or an investment recommendation, or an offer of, or solicitation for, a transaction in any financial instrument. LMAX Group has not verified the accuracy or basis-in-fact of any claim or statement made by any third parties as comments for every Blog entry.

LMAX Group will not accept liability for any loss or damage, including without limitation to, any loss of profit, which may arise directly or indirectly from use of or reliance on such information. No representation or warranty is given as to the accuracy or completeness of the above information. While the produced information was obtained from sources deemed to be reliable, LMAX Group does not provide any guarantees about the reliability of such sources. Consequently any person acting on it does so entirely at his or her own risk. It is not a place to slander, use unacceptable language or to promote LMAX Group or any other FX and CFD provider and any such postings, excessive or unjust comments and attacks will not be allowed and will be removed from the site immediately.

Day Image
6th June 2025 | view in browser
Markets brace for US jobs report

In just six months since President Trump’s inauguration, his once-strong alliance with Elon Musk has deteriorated into a public feud, with Musk criticizing the GOP’s tax-cut bill and Trump threatening Musk’s government contracts. Meanwhile, investors are cautious ahead of the U.S. May jobs report.


Performance chart 30day v. USD (%)
Performance Chart
 
 
Technical & fundamental highlights
EURUSD: technical overview

The Euro has finally broken out from a multi-month consolidation off a critical longer-term low. This latest push through the 2023 high lends further support to the case for a meaningful bottom, setting the stage for a bullish structural shift and the next major upside extension targeting the 2021 high at 1.2350. Setbacks should be exceptionally well supported below 1.1000.

EURUSD Chart
R2 1.1574 - 21 April/2025 high - Strong
R1 1.1495 - 5 June high - Medium
S1 1.1210 - 29 May low - Medium
S2 1.1065 - 12 May low - Strong
EURUSD: fundamental overview

Markets are bracing for the U.S. nonfarm payrolls report, expected to show a slowdown to 126,000 new jobs in May, with unemployment steady at 4.2%, though mixed signals from higher jobless claims (247,000) and a weak ADP report (37,000 jobs) suggest cooling hiring momentum. The European Central Bank cut rates for the eighth time in a year, but ECB President Christine Lagarde hinted at a potential pause in easing, while lowering inflation forecasts to hit 2% in 2025, dropping to 1.6% in 2026, and rebounding to 2% in 2027, boosting European stocks and pushing German 10-year Bund yields to a low of 2.49%. Eurozone Q1 GDP is expected to edge up to 0.4% quarter-over-quarter, but Germany faces challenges with a projected sharp decline in April industrial production (-1.0%) and a shrinking trade surplus (€19.1 billion), driven by weak exports and global trade tensions. ECB officials, including Lagarde, will speak today, potentially shedding light on future policy moves.

 
USDJPY: technical overview

There are signs of a meaningful top in place after the market put in a multi-year high in 2024. At this point, the door is now open for a deeper setback below the 2024 low at 139.58 over the coming sessions exposing a retest of the 2023 low. Rallies should be well capped below 150.00.

USDJPY Chart
R2 148.65 - 12 May high - Medium
R1 146.29 - 29 May high - Medium
S1 142.11 - 27 May low - Medium
S2 141.97 - 29 April low - Medium
USDJPY: fundamental overview

The yen weakened as markets awaited the U.S. jobs report, with cautious optimism sparked by Trump-Xi talks, though lacking concrete details. Japanese household spending unexpectedly fell 0.1% in April, missing the 1.5% growth forecast, signaling inflation’s strain on consumers and complicating the Bank of Japan’s plans, though Governor Kazuo Ueda reiterated readiness to raise rates if economic conditions align. Japanese stocks, including the Nikkei 225 (+0.4%) and Topix (+0.5%), rebounded modestly, while 10-year JGB yields dropped to 1.45% after strong bond auctions eased market pressures. The BOJ plans to further reduce bond purchases next year, signaling steady monetary policy normalization amid concerns over Japan’s fiscal health.

 
AUDUSD: technical overview

There are signs of the potential formation of a longer-term base with the market trading down into a meaningful longer-term support zone. Only a monthly close below 0.5500 would give reason for rethink. A monthly close back above 0.7000 will take the big picture pressure off the downside and strengthen case for a bottom.

AUDUSD Chart
R2 0.6550 - 25 November 2024 high - Strong
R1 0.6539 - 5 June/2025 high - Medium
S1 0.6344 - 24 April low - Medium
S1 0.6275 - 14 April low - Strong
AUDUSD: fundamental overview

Australian PM Anthony Albanese signaled openness to a beef trade deal with the U.S. to ease tariff tensions, despite strict biosecurity laws, ahead of potential G7 summit talks with Trump. Australia’s housing sector saw a 3.1% surge in private house approvals in April, though total dwelling approvals dropped 5.7% due to a sharp decline in multi-unit developments. The S&P/ASX 200 dipped 0.1% but remains set for a fourth weekly gain, with markets cautiously optimistic about U.S.-China trade talks despite ongoing tensions.

 
Suggested reading

Cathie Wood Goes Hunting: A Look at What She Bought, R. Munarriz, Motley Fool (June 4, 2025)

No, AI Robots Won’t Take All Our Jobs, R. Atkinson, WSJ (June 5, 2025)


Any opinions, news, research, analyses, prices or other information ("information") contained on this Blog, constitutes marketing communication and it has not been prepared in accordance with legal requirements designed to promote the independence of investment research. Further, the information contained within this Blog does not contain (and should not be construed as containing) investment advice or an investment recommendation, or an offer of, or solicitation for, a transaction in any financial instrument. LMAX Group has not verified the accuracy or basis-in-fact of any claim or statement made by any third parties as comments for every Blog entry.

LMAX Group will not accept liability for any loss or damage, including without limitation to, any loss of profit, which may arise directly or indirectly from use of or reliance on such information. No representation or warranty is given as to the accuracy or completeness of the above information. While the produced information was obtained from sources deemed to be reliable, LMAX Group does not provide any guarantees about the reliability of such sources. Consequently any person acting on it does so entirely at his or her own risk. It is not a place to slander, use unacceptable language or to promote LMAX Group or any other FX and CFD provider and any such postings, excessive or unjust comments and attacks will not be allowed and will be removed from the site immediately.

Day Image
5th June 2025 | view in browser
Weak US data boosts fed cut bets, Dollar slides

Weaker-than-expected U.S. economic data, with the May ISM Services Index dropping and ADP employment rising by only 37,000 jobs, both missing forecasts, drove down bond yields and the dollar as markets anticipated a softer Federal Reserve stance on rate cuts, with 57bps of cuts priced in for 2025.


Performance chart 30day v. USD (%)
Performance Chart
 
 
Technical & fundamental highlights
EURUSD: technical overview

The Euro has finally broken out from a multi-month consolidation off a critical longer-term low. This latest push through the 2023 high lends further support to the case for a meaningful bottom, setting the stage for a bullish structural shift and the next major upside extension targeting the 2021 high at 1.2350. Setbacks should be exceptionally well supported below 1.1000.

EURUSD Chart
R2 1.1474 - 11 April high - Medium
R1 1.1455 - 3 June high - Medium
S1 1.1210 - 29 May low - Medium
S2 1.1065 - 12 May low - Strong
EURUSD: fundamental overview

The European Central Bank is poised to cut its deposit rate by 25 basis points to 2% at its upcoming meeting, supported by Eurozone inflation falling to 1.9% in May, below the 2% target, and declining core inflation due to weaker services inflation. Sluggish GDP growth and trade tensions, particularly from rising U.S. tariffs, strengthen the case for further easing, with markets anticipating another 25bps cut by September, potentially bringing the rate to 1.75%, seen as the neutral zone. The ECB may downgrade its growth and inflation forecasts, and significant downward revisions could signal more cuts if inflation projections fall below 1.7% for 2026. Despite these cuts, EURUSD remains supported by a weakening dollar due to U.S. fiscal concerns and a potential Fed rate cut later in 2025, narrowing the rate differential, while optimistic EU-U.S. trade talks are tempered by concerns over new tariffs.

 
USDJPY: technical overview

There are signs of a meaningful top in place after the market put in a multi-year high in 2024. At this point, the door is now open for a deeper setback below the 2024 low at 139.58 over the coming sessions exposing a retest of the 2023 low. Rallies should be well capped below 150.00.

USDJPY Chart
R2 148.65 - 12 May high - Medium
R1 146.29 - 29 May high - Medium
S1 142.11 - 27 May low - Medium
S2 141.97 - 29 April low - Medium
USDJPY: fundamental overview

The Bank of Japan is signaling a shift from ultra-loose monetary policy, with Governor Ueda confirming ongoing bond purchase reductions to improve market functionality, while setting aside full provisions for expected bond transaction losses as interest rates rise. Weak demand at the latest 30-year JGB auction, with the lowest bid-to-cover ratio since 2023, suggests investor caution, potentially supporting yen strength as higher yields attract capital. Despite solid nominal wage growth of 2.3–2.6% in April, real wages fell 1.8% year-on-year, continuing a two-year decline that erodes household purchasing power and may constrain aggressive BOJ rate hikes. Analysts anticipate no rate change at the June 16-17 meeting but see a possible hike in July due to persistent inflation, with one major bank forecasting a yen appreciation of over 5% against the dollar by year-end.

 
AUDUSD: technical overview

There are signs of the potential formation of a longer-term base with the market trading down into a meaningful longer-term support zone. Only a monthly close below 0.5500 would give reason for rethink. A monthly close back above 0.7000 will take the big picture pressure off the downside and strengthen case for a bottom.

AUDUSD Chart
R2 0.6550 - 25 November 2024 high - Strong
R1 0.6538 - 26 May/2025 high - Medium
S1 0.6344 - 24 April low - Medium
S1 0.6275 - 14 April low - Strong
AUDUSD: fundamental overview

The Reserve Bank of Australia’s May meeting minutes revealed a dovish tilt, with some members considering a 50bps rate cut as a precaution against global trade risks and U.S. tariff hikes, though no immediate shift to expansionary policy was deemed necessary. Australia’s Q1 GDP grew a weaker-than-expected 0.2%, below the 0.4% forecast, signaling vulnerability to global trade tensions and reinforcing expectations for an RBA rate cut in July. April’s trade surplus narrowed to A$5.41 billion, below the A$6 billion forecast, driven by a sharp 2.4% drop in exports and a 1.1% rise in imports, while household spending grew a modest 0.1% month-on-month, reflecting cautious consumer behavior amid global uncertainties. The OECD’s warning of a stalling global economy due to U.S. tariffs, particularly impacting China, Australia’s key trading partner, further supports the RBA’s cautious approach.

 
Suggested reading

Petrobras: fuelling the future or stuck in the past?, G. Bobillot, Financial Times (June 4, 2025)

An Interest Rate Freight Train Could Hit the Markets Hard, L. Lango, InvestorPlace (June 4, 2025)


Any opinions, news, research, analyses, prices or other information ("information") contained on this Blog, constitutes marketing communication and it has not been prepared in accordance with legal requirements designed to promote the independence of investment research. Further, the information contained within this Blog does not contain (and should not be construed as containing) investment advice or an investment recommendation, or an offer of, or solicitation for, a transaction in any financial instrument. LMAX Group has not verified the accuracy or basis-in-fact of any claim or statement made by any third parties as comments for every Blog entry.

LMAX Group will not accept liability for any loss or damage, including without limitation to, any loss of profit, which may arise directly or indirectly from use of or reliance on such information. No representation or warranty is given as to the accuracy or completeness of the above information. While the produced information was obtained from sources deemed to be reliable, LMAX Group does not provide any guarantees about the reliability of such sources. Consequently any person acting on it does so entirely at his or her own risk. It is not a place to slander, use unacceptable language or to promote LMAX Group or any other FX and CFD provider and any such postings, excessive or unjust comments and attacks will not be allowed and will be removed from the site immediately.