


 | ||
| 21st August 2025 | view in browser | ||
| Powell’s neutral stance lifts dollar pre-Jackson Hole | ||
| The U.S. dollar ended Wednesday mid-range as markets digested the Federal Reserve’s latest minutes and speculation about a potential Trump-appointed replacement for Governor Cook. | ||
| Performance chart 30day v. USD (%) | ||
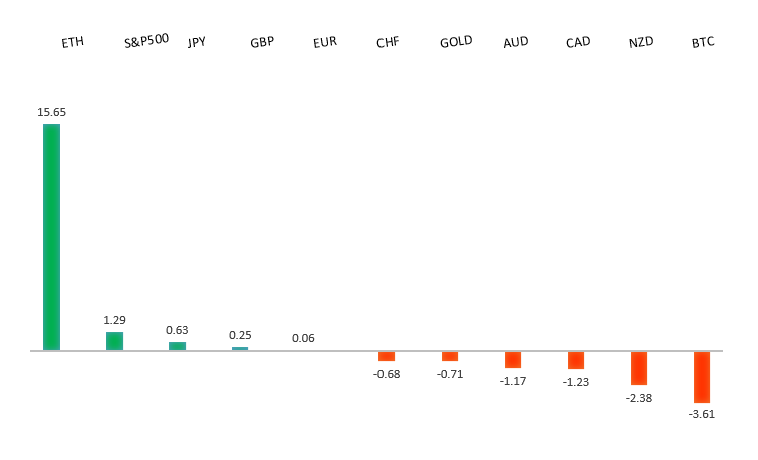 | ||
| Technical & fundamental highlights | ||
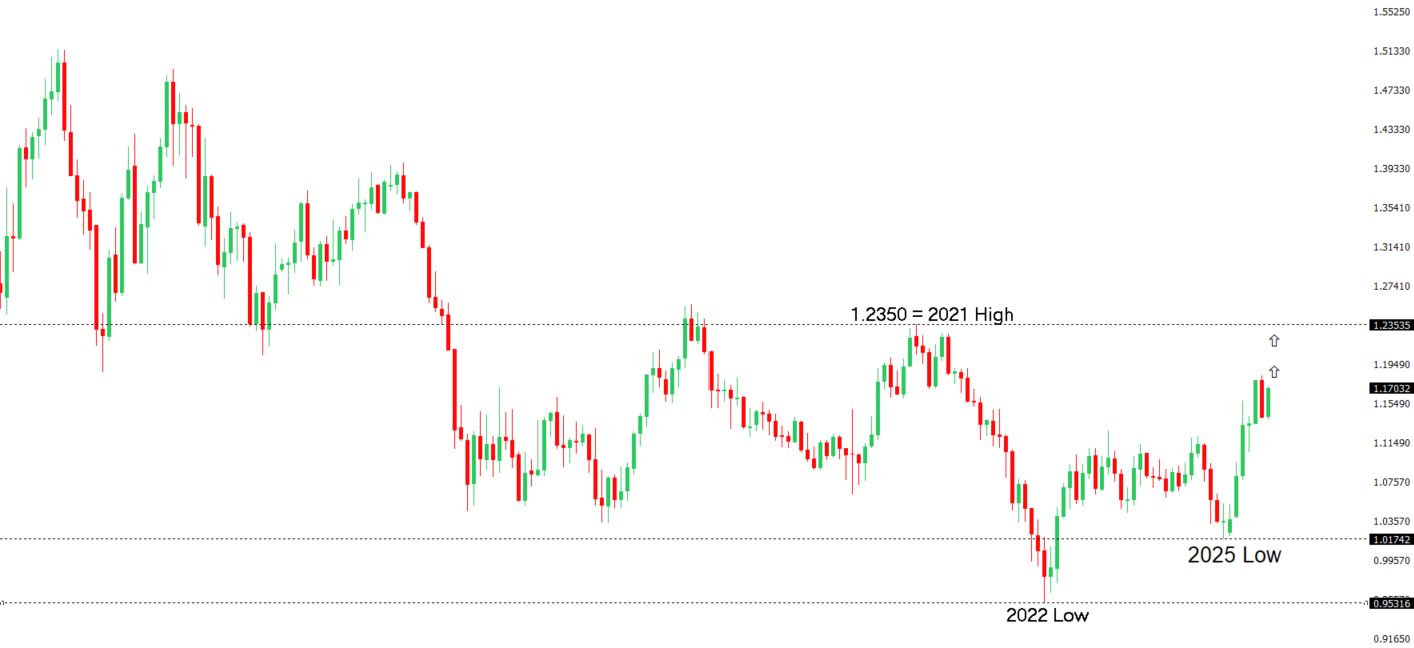
| EURUSD: technical overview | ||
| The Euro has broken out from a multi-month consolidation off a critical longer-term low. This latest push through the 2023 high (1.1276) lends further support to the case for a meaningful bottom, setting the stage for a bullish structural shift and the next major upside extension targeting the 2021 high at 1.2350. Setbacks should be exceptionally well supported ahead of 1.1000. | ||
 | ||
| R2 1.1789 - 24 July high - Medium R1 1.1731 - 13 August high - Medium S1 1.1528 - 5 August low - Medium S2 1.1392 - 1 August low - Strong | ||
| EURUSD: fundamental overview | ||
| The Eurozone’s July inflation remained stable, with headline CPI at 2.0% and core CPI at 2.3%, aligning with the ECB’s target. Services inflation eased slightly to 3.2%, and contained wage growth suggests further moderation. Despite trade tensions with the US, including a 15% tariff on European goods, the ECB is likely to pause rate adjustments in September, awaiting clearer impacts from tariffs and trade deals. ECB President Christine Lagarde noted slower growth this quarter but highlighted reduced uncertainty from recent US trade agreements. Geopolitical tensions persist, with conflicting reports on Russia-Ukraine talks complicating peace prospects. | ||
| USDJPY: technical overview | ||
| There are signs of a meaningful top in place after the market put in a multi-year high in 2024. At this point, the door is now open for a deeper setback below the 2024 low at 139.58, exposing a retest of the 2023 low. Rallies should be well capped below 152.00. | ||
 | ||
| R2 150.92 - 1 August high - Strong R1 148.52 - 12 August high - Medium S1 146.21 - 14 August low - Medium S2 145.85 - 24 July low - Strong | ||
| USDJPY: fundamental overview | ||
| Long-term Japanese government bond yields surged due to fiscal concerns, with 10-year yields reaching 1.62%, the highest since 2008, and 20- and 30-year yields hitting 2.64% and 3.20%, respectively. Overseas investors continued buying ultra-long JGBs for the seventh consecutive month, stabilizing the market and supporting the yen, with domestic demand expected to limit aggressive selling. Japan’s July CPI, due on August 21, is projected to stay high at 3.1%-3.3%, potentially fueling expectations of a Bank of Japan rate hike in October if inflation persists, though weak export data due to U.S. tariffs and global trade issues may complicate this decision. Meanwhile, markets are cautious about the yen-dollar exchange rate ahead of Fed Chair Powell’s upcoming Jackson Hole speech, which could influence the current trading range. | ||
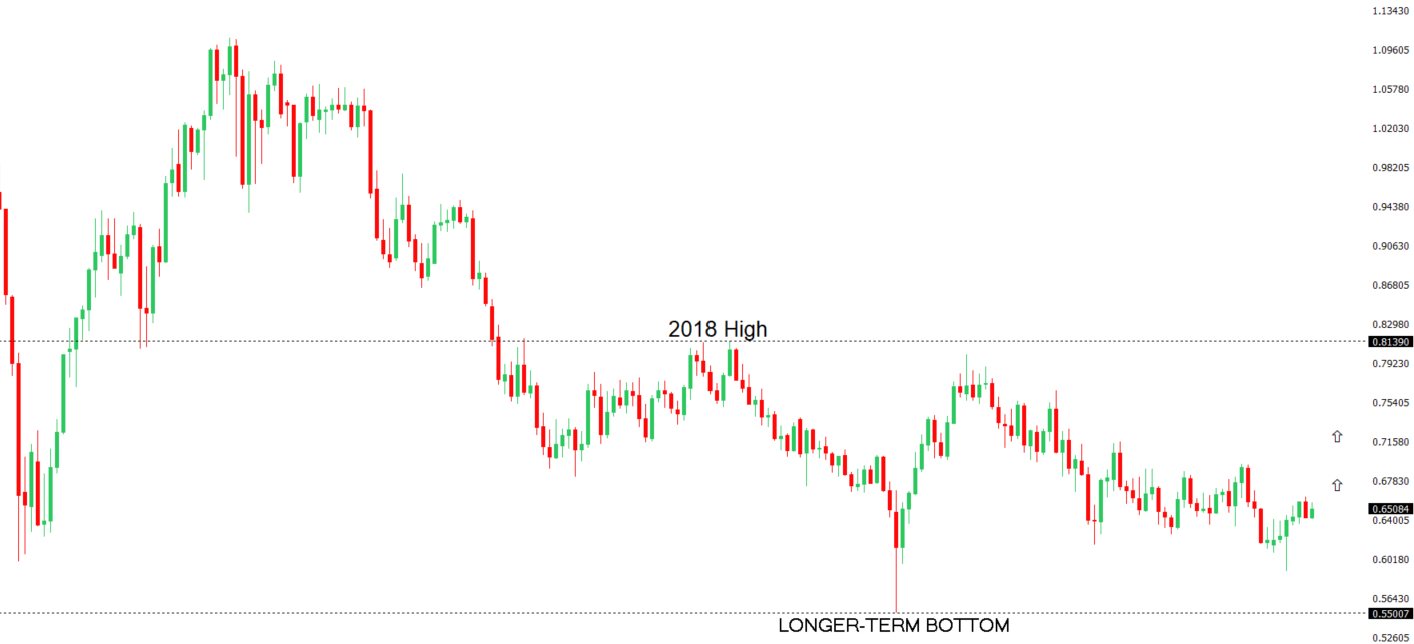
| AUDUSD: technical overview | ||
| There are signs of the potential formation of a longer-term base with the market trading down into a meaningful longer-term support zone. Only a monthly close below 0.5500 would give reason for rethink. A monthly close back above 0.7000 will take the big picture pressure off the downside and strengthen case for a bottom. | ||
 | ||
| R2 0.6600 - Figure - Medium R1 0.6569 - 14 August high - Medium S1 0.6419 - 1 August low - Medium S1 0.6373 - 23 June low - Strong | ||
| AUDUSD: fundamental overview | ||
| A sharp Nasdaq selloff triggered risk-averse sentiment, weakening high-beta G10 currencies like the Australian dollar against the US dollar, with markets cautious ahead of Fed Chair Powell’s Jackson Hole speech, which could challenge expectations for a September rate cut. Australia’s economy is projected to grow steadily, with GDP forecasts holding at 0.5% for Q2 and Q3 2025, and annual growth expected at 1.6% in 2025, 2.2% in 2026, and 2.5% in 2027, while inflation remains stable at 2.5% in 2025 and 2.7% in 2026, according to Bloomberg’s August survey. The RBA’s cash rate is expected to stay at 3.60% through Q3 2025, though some economists predict stickier inflation and potential rate hikes by late 2026. Recent PMI data shows robust economic activity, with the composite index rising to 54.9 in August, driven by strong services sector growth and a notable manufacturing uptick, signaling resilience and benefits from recent RBA rate cuts. | ||
| Suggested reading | ||
| Why 2025 Is the Year to Invest in International Stocks, D. Lefkovitz, Morningstar (August 20, 2025) The Downside Of Index Funds & ETFs, B. Arends, MarketWatch (August 20, 2025) | ||