


 | ||
| 20th January 2026 | view in browser | ||
| Tariffs, turmoil and treasuries | ||
| Rising global yields, political risk, and escalating trade frictions are creating a fragile macro backdrop for investors heading into the new day. | ||
| Performance chart 30day v. USD (%) | ||
 | ||
| Technical & fundamental highlights | ||
| EURUSD: technical overview | ||
| The Euro outlook remains constructive with higher lows sought out on dips in favor of the next major upside extension targeting the 2021 high at 1.2350. Setbacks should be exceptionally well supported ahead of 1.1400. | ||
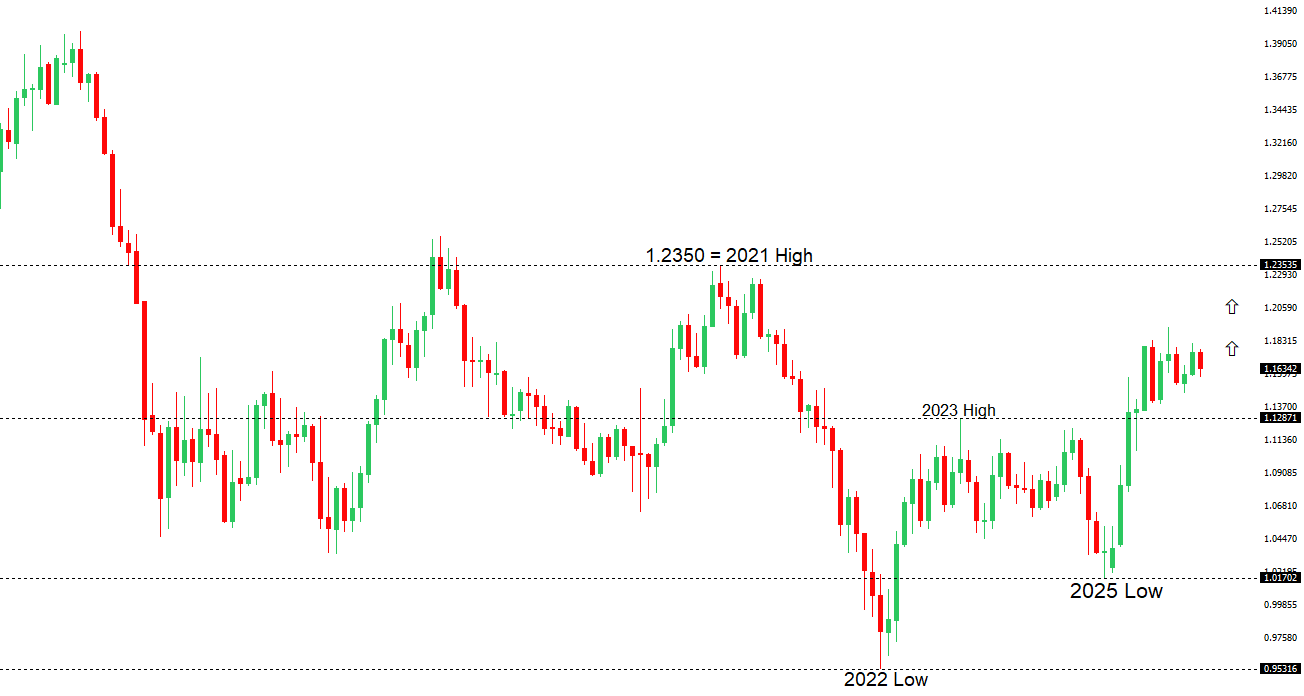 | ||
| R2 1.1808 - 24 December high -Strong R1 1.1699 - 12 Janaury high - Medium S1 1.1577 - 19 January /2026 low - Medium S2 1.1530 - 7 November low - Medium | ||
| EURUSD: fundamental overview | ||
| The euro edged up as a softer dollar followed President Trump’s threat of tariffs linked to the Greenland dispute, reviving political risk just as European assets had been attracting fresh inflows. European leaders condemned the move, the EU froze approval of a July trade deal, and lawmakers are weighing retaliatory tools, warning of a serious rupture in transatlantic ties. While markets see uncertainty over whether the tariffs will be implemented, analysts note even a 10% levy could shave about 0.1%–0.2% off euro-area GDP, with Germany most exposed, and keep attention on Europe’s political response and today’s ZEW sentiment data. | ||
| USDJPY: technical overview | ||
| There are signs of a meaningful top in place after the market put in a multi-year high in 2024. At this point, rallies should be well capped ahead of 160.00 ahead of a fresh down-leg back towards the 2024 low at 139.58. A break below 154.39 will strengthen the outlook. | ||
 | ||
| R2 160.00 - Psychological - Strong R1 159.46 - 14 January /2026 high - Medium S1 157.42 - 19 January low - Medium S2 156.11 - 5 January/2026 low - Strong | ||
| USDJPY: fundamental overview | ||
| The yen has edged slightly stronger but remains under pressure, with USDJPY still holding near multi-month highs as rising long-term JGB yields, fiscal easing concerns under PM Takaichi, and the Feb. 8 snap election keep investors cautious. Markets are positioning for a continued “sell-yen” macro mix of looser fiscal policy offsetting any BOJ tightening, though heavy speculative shorts leave the currency vulnerable to sharp squeezes on any BOJ hawkish surprise, intervention risk, or global risk-off move. | ||
| AUDUSD: technical overview | ||
| There are signs of the potential formation of a longer-term base with the market trading down into a meaningful longer-term support zone. Only a monthly close below 0.5500 would give reason for rethink. A monthly close back above 0.7000 will take the big picture pressure off the downside and strengthen case for a bottom. | ||
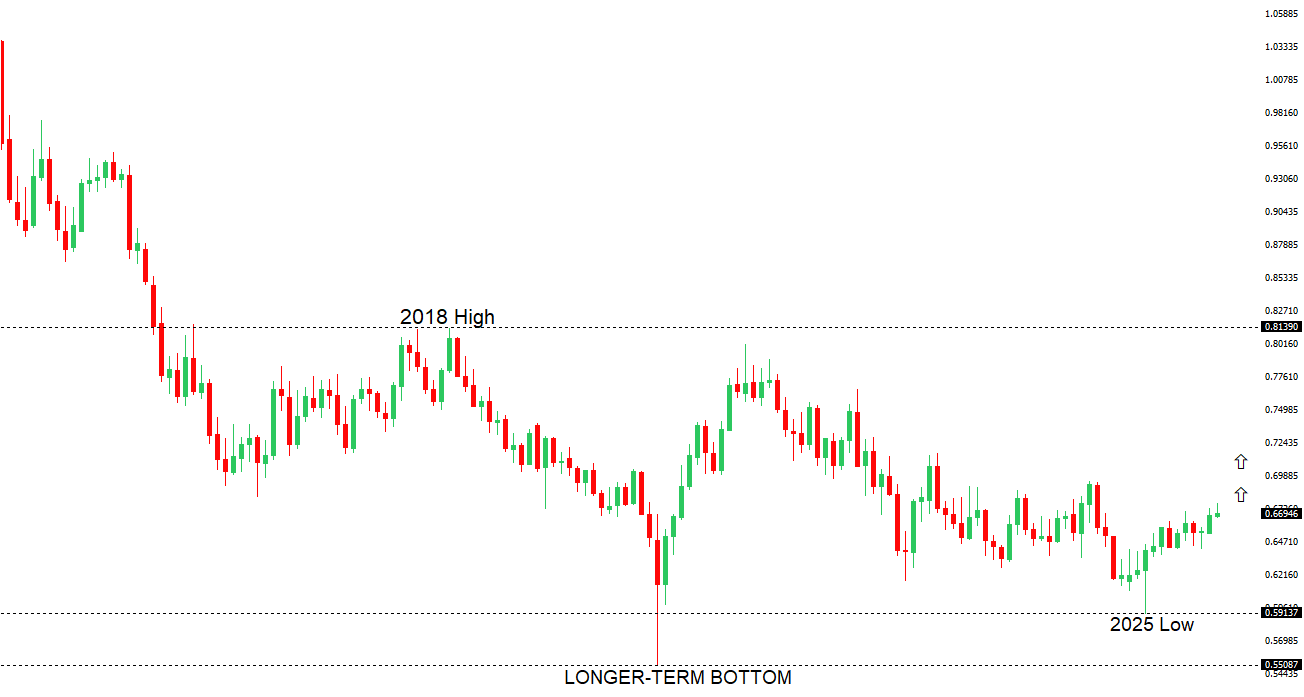 | ||
| R2 0.6800 - Figure - Medium R1 0.6767 - 7 January/2026 high - Medium S1 0.6660 - 31 December low - Medium S2 0.6592 - 18 December low - Strong | ||
| AUDUSD: fundamental overview | ||
| AUD has regained momentum and is one of the best-performing G10 currencies versus the dollar. Strong December inflation data points to sticky Q4 CPI, keeping the RBA firmly in “hold or hike” mode, with markets pricing around 40bp of tightening this year — the most hawkish path in G10. With inflation likely to stay above target well into 2026 and some major banks forecasting a hike as early as February, Australia stands out as a rare tightening outlier, reinforcing the bullish AUD narrative even as speculative shorts are gradually being unwound. | ||
| Suggested reading | ||
| How State Capital Is Reshaping Supply Chains, W. Marshall, CFA Institute (January 12, 2026) 2026 Outlook: Smothering Heights, M. Cembalest, J.P. Morgan (January 1, 2026) | ||