


 | ||
| 26th March 2026 | view in browser | ||
| Uncertainty and oil surge complicate rate path | ||
| The dollar is firmer and equities are under pressure as rising oil prices and ongoing Iran-related uncertainty sharpen focus on inflation risks and the global interest rate outlook. | ||
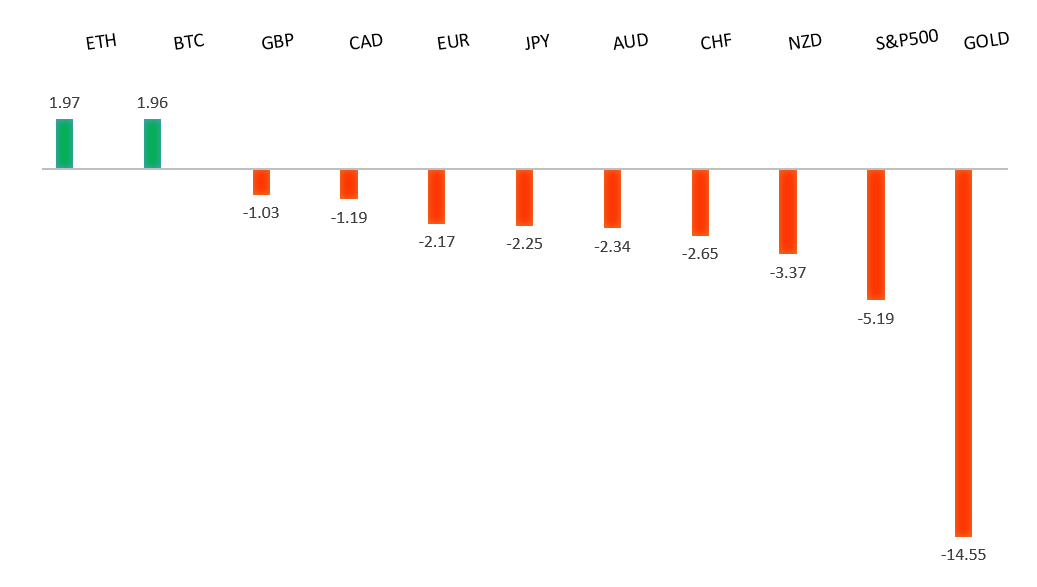
| Performance chart 30day v. USD (%) | ||
 | ||
| Technical & fundamental highlights | ||
| EURUSD: technical overview | ||
| The Euro outlook remains constructive with higher lows sought out on dips in favor of the next major upside extension targeting the 2021 high at 1.2350. Setbacks should be exceptionally well supported ahead of 1.1300. | ||
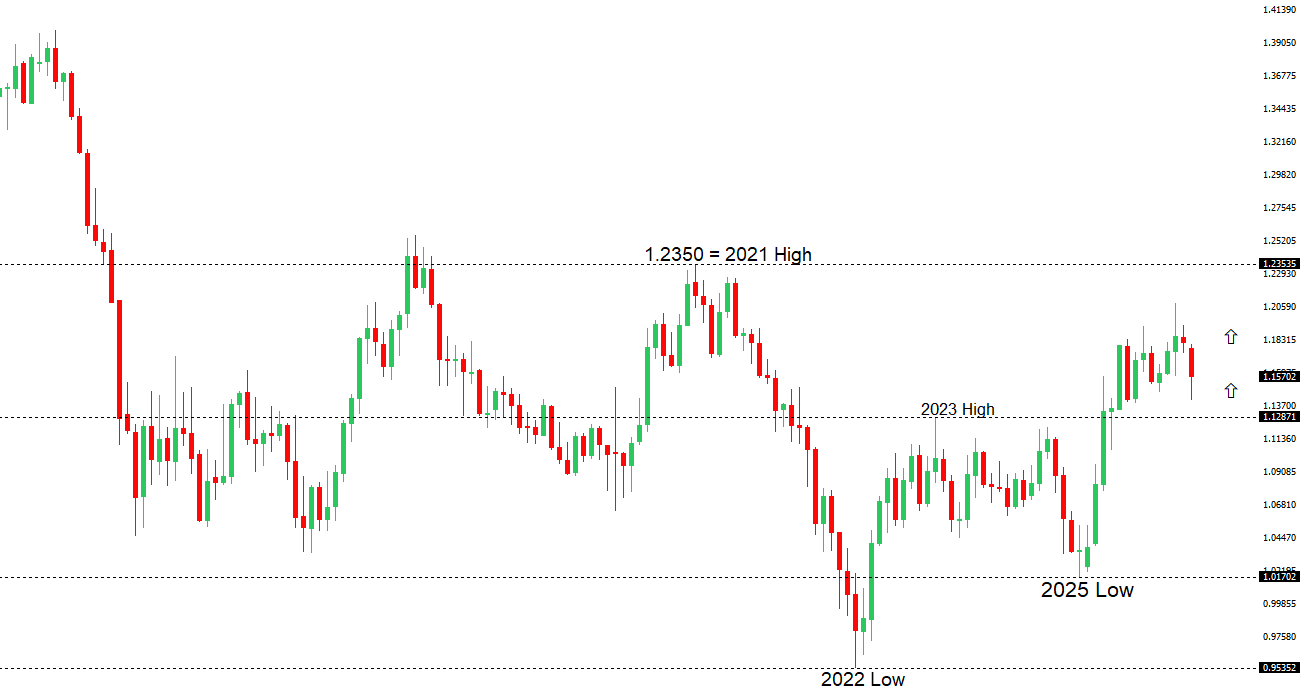 | ||
| R2 1.1668 - 10 March high - Strong R1 1.1641 - 23 March high - Medium S1 1.1411 - 13 March/2026 low - Medium S2 1.1400 - Figure - Strong | ||
| EURUSD: fundamental overview | ||
| The euro remains under pressure, weighed down by rising energy costs and a weaker trade outlook. ECB officials, including Villeroy, are pushing back against expectations for rate cuts, emphasizing the need to contain inflation risks—especially from higher energy prices feeding into wages—while keeping policy flexible. With oil surging and inflation forecasts rising, the ECB is prioritizing price stability even as growth slows, leaving the euro vulnerable amid this mix of economic strain and persistent inflation concerns. | ||
| USDJPY: technical overview | ||
| There are signs of the formation of a meaningful top after the market put in a multi-year high in 2024. At this point, rallies should be well capped above 160.00 in favor of a fresh down-leg back towards the 2024 low at 139.58. Only a monthly close above 160.00 negates. | ||
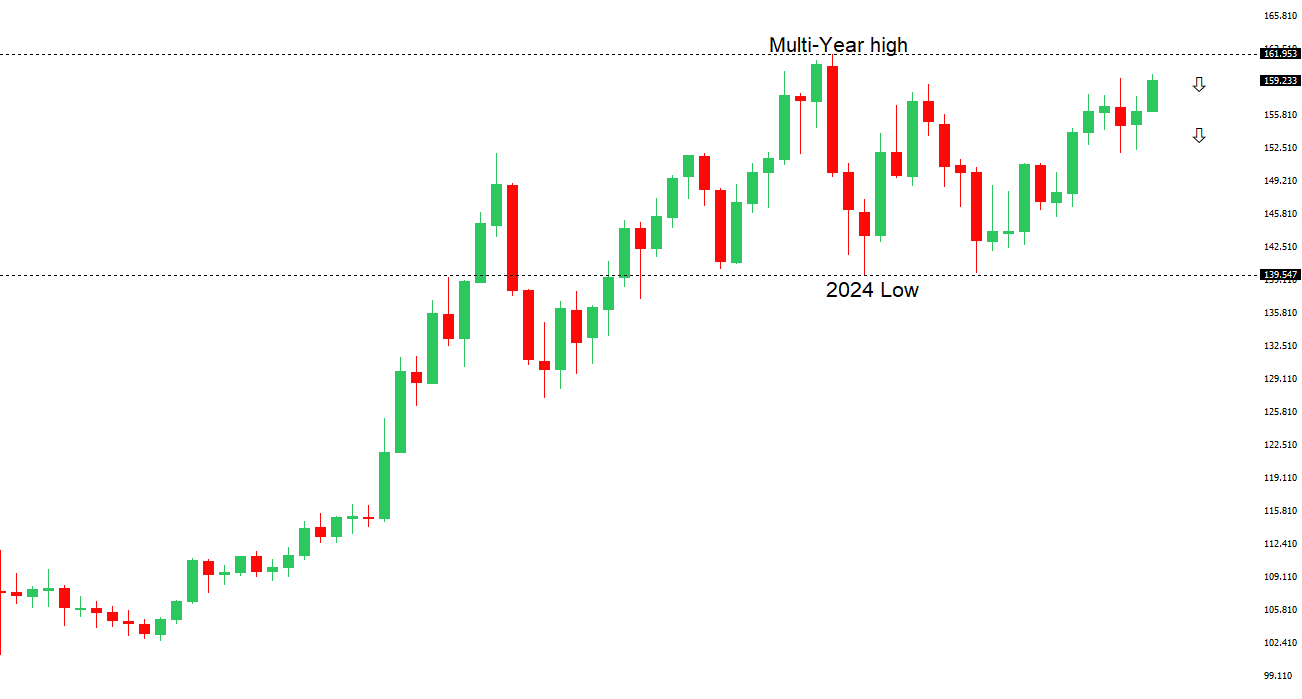 | ||
| R2 160.00 - Psychological - Strong R1 159.91 - 18 March/2026 high - Medium S1 157.27 - 10 March low - Medium S2 156.45 - 5 March low - Strong | ||
| USDJPY: fundamental overview | ||
| The yen edged slightly higher in Asian trading, supported by a rise in Japan’s 2-year yields to a multi-decade high and growing expectations for additional rate hikes this year, which have helped counter pressure from high energy prices. While services inflation came in slightly stronger, it hasn’t meaningfully shifted expectations for the Bank of Japan’s gradual policy path. Instead, markets remain more focused on mixed signals around US-Iran talks, with ongoing tensions reinforcing the likelihood of a prolonged conflict and continued support for the US dollar. | ||
| AUDUSD: technical overview | ||
| There are signs of the formation of a longer-term base with the market recovering out from a meaningful longer-term support zone. The latest monthly close back above 0.7000 takes the big picture pressure off the downside and strengthens the case for a bottom, with the focus now on a push towards 0.8000. Setbacks should now be well supported ahead of 0.6700. | ||
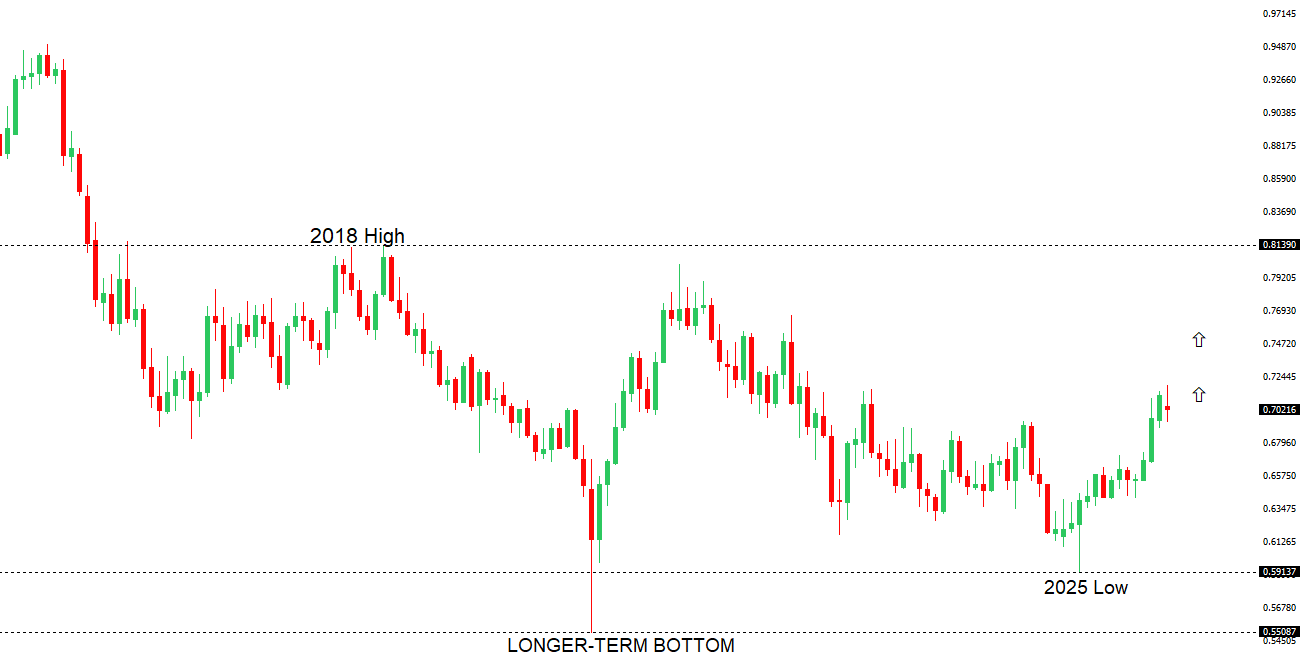 | ||
| R2 0.7200 - Figure - Medium R1 0.7188 - 11 March/2026 high - Medium S1 0.6910 - 23 March low - Medium S2 0.6897 - 6 February low - Strong | ||
| AUDUSD: fundamental overview | ||
| The Australian dollar is under mild pressure on Thursday. Reserve Bank of Australia Governor Kent warned that rising oil prices are creating a difficult policy trade-off, pushing inflation higher while slowing growth, with the biggest concern being longer-term inflation expectations. Meanwhile, with tensions unresolved in the US-Iran conflict, the AUD remains under pressure as the US dollar continues to see strong demand across global markets. | ||
| Suggested reading | ||
| Why This Is One of the Riskiest Times of the 21st Century, R. Forsyth, Barron’s (March 20, 2026) Gold As An Inflation Hedge? Why Is It Falling Now?, Fisher Investments (March 24, 2026) | ||