


LMAX Exchange
​​​​​Recently at LMAX Exchange we’ve had a couple of services suffer from memory leaks.
In both cases, we noticed the problem much later than we’d like. One stricken application started to apply backpressure on (really rather important) upstream components. Another caused an account related action to be intermittently unavailable.
What we’d like to be able to do is detect when any of our java services is in acute heap distress as soon as it enters that state. We already have monitoring around causes of backpressure; we want to spot our issue a little earlier on in the causality graph (that’s two ridiculous names you’ve invented just in one paragraph. Enough! – Ed).
Handily, each service already publishes its heap usage and gc times to our home-grown monitoring app. Even better, our alerting application already streams live events from that monitor into some alerting rules, so we have some existing scaffolding to build on top of.
We reworked the way the existing streaming sensors in our alerting app worked until we had something like the following:
void addStreamingSensor(
    final String keyPattern,
    final Consumer<MonitoringEvent> consumer,
    final FaultSensor faultSensor);

interface FaultSensor {
    Collection<Fault> sense();
}

class MonitoringEvent {
    public final long epochMillis;
    public final String key;
    public final double value;

    public MonitoringEvent(long epochMillis, String key, double value) {
        this.epochMillis = epochMillis;
        this.key = key;
        this.value = value;
    }
}

class Fault {
    public final String description;
    public final String url;

    public Fault(final String description, final String url) {
        this.description = description;
        this.url = url;
    }
}
This construction will set things up so that monitoring events matching our key pattern are delivered to our consumer.
Side note: we ended up with the following signature, mostly because using this little known java feature always makes me smile:
<T> extends Consumer<MonitoringEvent> & FaultSensor> void addStreamingSensor(final String keyPattern, final T t);
Occasionally, a different thread will call sense to see if any faults are currently present.
In our case, the keys we have available to us (per application, per host) are ‘heap.used’, ‘heap.max’ (both in bytes) and ‘gc.pause’. Can we reliably detect heap distress from such a stream of events?
Bad ideas we considered
Percentage of wall clock time spent in GC
We could work out what percentage of time an application is spending in GC, and alert if it goes above a threshold.
This isn’t too bad an idea. Unfortunately, that metric is published at most once per second per application, and it lists the maximum pause time seen in that second, not the sum. We could fix this, but we’d have to wait for a software release to get feedback.
Persistent memory usage above a threshold percentage
One thing we see in both of our failing applications is that they see consistent heap usage somewhere near to their max value. We could keep track of how many observations we see above a particular usage threshold, and once that observation count reaches a large enough number, alert.
This would detect errors like the ones that we would see, but it would also detect slow growing heaps in well behaved applications. Alert code that produces more false alarms than real ones is, from our experience, worse than no alerting at all.
    @Test
    public void slowlyRisingUsageIsNotAFault()
    {
        useHealthyHeapThresholdOf(90, Percent);

        reportHeapMax("hostOne", "serviceOne", 100.0);
        reportHeapUsage("hostOne", "serviceOne", 65.0);
        reportHeapUsage("hostOne", "serviceOne", 75.0);
        reportHeapUsage("hostOne", "serviceOne", 85.0);
        reportHeapUsage("hostOne", "serviceOne", 95.0);

        assertFaultFree();
    }
Alerting if an inferred GC reclaims less than a certain percentage of memory
We can keep hold of the last seen usage, and when a new value arrives, check if it is smaller. If it is, we can infer that a GC has occurred. If the amount of memory freed by that GC is too small, we could alert.
Closer still, but can still generate some false positives. A collection can be triggered even when percentage heap usage is low; at that point it might be impossible to reclaim the required amount.
    @Test
    public void punyAmountsFreedByGcAreNotFaultsIfEnoughHeapIsStillFree()
    {
        useHealthyHeapThresholdOf(90, Percent);

        reportHeapMax("hostOne", "serviceOne", 100.0);

        reportHeapUsage("hostOne", "serviceOne", 85.0);
        reportHeapUsage("hostOne", "serviceOne", 86.0);
        reportHeapUsage("hostOne", "serviceOne", 87.0);
        reportHeapUsage("hostOne", "serviceOne", 85.0);

        assertFaultFree();
    }
Our eventual solution
Alert if, after an inferred GC, more than x% of the heap is still in use.
Still not perfect, but just about good enough. Why? Well, we see multiple ‘heap.used’ metrics published across a GC cycle, some of which may still be above the warning usage threshold. Those intermediate values could cause false positives.
In practice, we found that we call ‘currentFaults’ infrequently enough to not be a problem. If we did, it would be the work of a couple of minutes to create a wrapper for our detector that only reported faults that had been present for multiple seconds.
    @Test
    public void afterAnInferredGcFaultIsReportedUntilHeapDropsBelowThreshold()
    {
        useHealthyHeapThresholdOf(90, Percent);

        reportHeapMax("hostOne", "serviceOne", 100.0);
        reportHeapUsage("hostOne", "serviceOne", 85.0);
        reportHeapUsage("hostOne", "serviceOne", 95.0);
        reportHeapUsage("hostOne", "serviceOne", 93.0);

        assertFaulty("hostOne", "serviceOne");

        reportHeapUsage("hostOne", "serviceOne", 90.1);

        assertFaulty("hostOne", "serviceOne");

        reportHeapUsage("hostOne", "serviceOne", 89.0);

        assertFaultFree();
    }
Bugs we totally missed
Some applications run on multiple hosts in the same environment
This one was a bit silly.
We run our applications in six or seven different ‘environments’ that we consider important enough to monitor. Each environment might have application ‘x’ deployed on hosts ‘h1’ and ‘h2’. We managed to not test this at all in our spike implementation and immediately generated large numbers of false positives. Whoops.
    @Test
    public void servicesOnDifferentHostsDoNotInterfereWithEachOther()
    {
        useHealthyHeapThresholdOf(90, Percent);

        reportHeapMax("hostOne", "serviceOne", 100.0);
        reportHeapMax("hostTwo", "serviceOne", 100.0);

        reportHeapUsage("hostOne", "serviceOne", 85.0);
        reportHeapUsage("hostOne", "serviceOne", 95.0);
        reportHeapUsage("hostTwo", "serviceOne", 93.0);

        assertFaultFree();
    }
More mysterious false positives
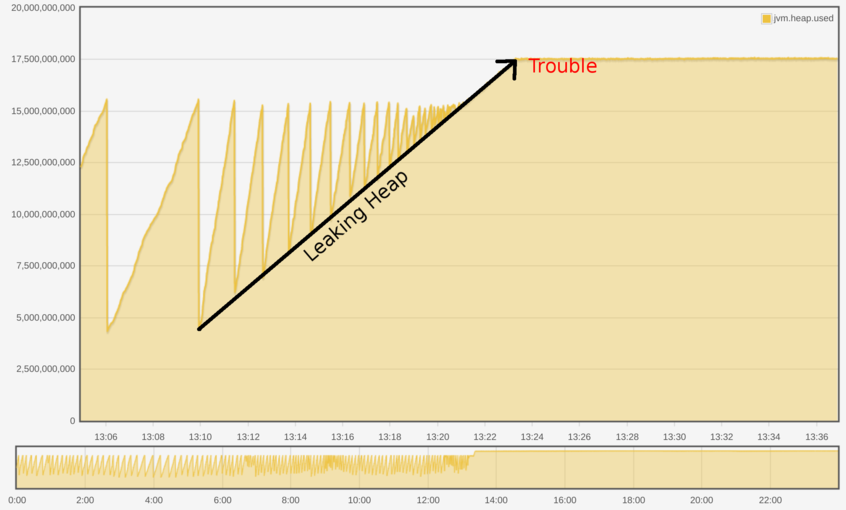
Having now written enough tests to convince ourselves that we weren’t totally inept, we launched the alerting app locally. We turned the warning threshold down to 10% to see if it spotted anything, and immediately saw some alerts. Clicking each alert (the ‘url’ feature of a fault is used to allow a user to see the data upon which the decision to alert was raised) led us to the following chart.
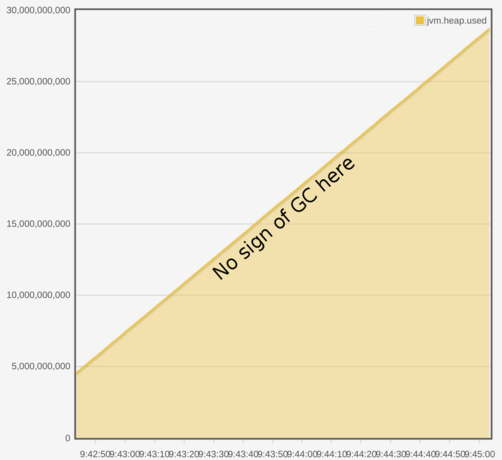
The data underlying the chart looks like this:
epoch millis ,heap usage (bytes)
1494497832745,1.477746688E9
1494497833564,1.479913472E9
1494497833745,1.479913472E9
1494497834564,1.48424704E9
1494497834745,1.48424704E9
1494497835564,1.488580608E9
1494497835745,1.488580608E9
1494497836564,1.492914176E9
1494497836745,1.492914176E9
1494497837564,1.49508096E9
1494497837745,1.49508096E9
1494497838564,1.49508096E9
1494497838745,1.49508096E9
1494497839564,1.497247744E9
1494497839745,1.497247744E9
1494497840564,1.497247744E9
This was a bit odd. We added some judicious println at the point where we raised the alert, and found we had received the following:
Raising alert: heap dropped from 1.49508096E9 to 1.492914176E9
At this point, a light went on in my head, and we went back to log not only the values we were seeing, but also the timestamps of the monitoring events.
Raising alert: heap dropped from 1.49508096E9 (at 1494497837564) to 1.492914176E9 (at 1494497836745)
Aha. We appear to have gone back in time. How is this happening, though?
Well, we deliberately use UDP to transmit metrics from our applications to our monitoring. We’re OK with occasionally losing some metrics, we’re definitely not happy if being unable to send them prevents our app from actually running. This is a potentially controversial choice, let’s agree to not discuss it here :-).
When metrics arrive at the monitoring app, it has two jobs. One, to squirrel the data into a time series database on disk. Two, to transmit the data to appropriately subscribed websocket clients.
The chart and raw data above are both served, post hoc, via the on disk store. The websocket feed is not. The UDP packets of monitoring data were arriving out of order, and it was truthfully forwarding those metrics to our alerting in the same way.
We could probably fix that with some judiciously applied buffering, but given that each event we see is timestamped, we can simply drop events that are timestamped earlier than the last value we saw for a given service/host pair.
    @Test
    public void doNotReportFaultsBasedOnOutOfOrderData()
    {
        useHealthyHeapThresholdOf(90, Percent);

        reportHeapMax("hostOne", "serviceOne", 100.0);

        reportHeapUsage("hostOne", "serviceOne", 85.0);
        currentTime += 10;
        reportHeapUsage("hostOne", "serviceOne", 95.0);
        currentTime -= 5;
        reportHeapUsage("hostOne", "serviceOne", 93.0);

        assertFaultFree();
    }
Moral(s) of the story
Even the simplest thing needs more thinking about than you might normally expect! We got things wrong a lot, but it didn’t matter, because:
- we had a very testable interface, so we could improve quickly
- we could run the whole app locally to tell us what tests we missed