


Next 24 hours: Currencies all over the map
Today’s report: US market returns from holiday break
Trading conditions should pick back up on Tuesday, after a relatively uneventful and expected uneventful start to the week on account of the US holiday. We did see some demand for the Euro and Pound on Monday, though the demand was mild.
Wake-up call
- solid data
- lockdown restrictions
- Dealers report
- lockdown extension
- business outlook
- commodity price
- Stocks vulnerable
- Dealers report
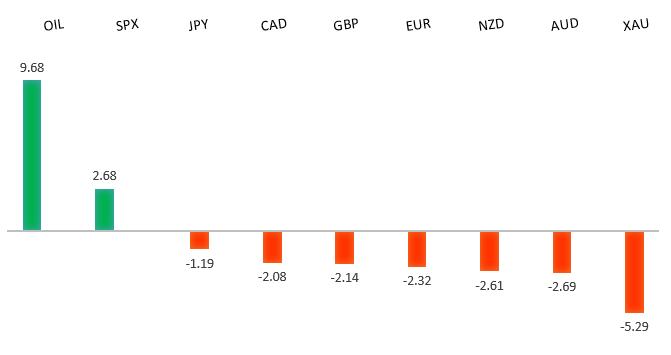
Peformance chart: 30 Day Performance vs. US dollar (%)
Suggested reading
- Gold Regains Shine After Central Bank Buying Drops, Bloomberg (July 4, 2021)
- Didi Chuxing’s IPO, Crackdowns In Hong Kong, Forbes (July 4, 2021)
Chart talk: Technical & fundamental highlights
Choose pair:
EURUSD – technical overview
The market has been looking for a higher low since topping out in 2021 up at 1.2350. Ideally, this next higher low is sought out ahead of 1.1600 in favour of the next major upside extension back through 1.2350 and towards a retest of the 2018 high at 1.2555 further up.EURUSD – fundamental overview
Trading was quiet on Monday on account of the US holiday, but we did see some Euro demand from an overall better than expected round of Eurozone data, including services PMIs and Sentix confidence. Key standouts on Tuesday’s calendar come from the RBA policy decision, German factory orders, Eurozone construction PMIs, Eurozone retail sales, Eurozone and German ZEW sentiment reads, and US ISM non-manufacturing.EURUSD - Technical charts in detail
GBPUSD – technical overview
Technical studies are in the process of consolidating from stretched levels after the push to fresh multi-month highs. This leaves room for additional consolidation, before the market considers a meaningful bullish continuation towards a retest of the 2018 high. But look for setbacks to now be very well supported into the 1.3500 area.GBPUSD – fundamental overview
UK PMI reads were above forecast and the market prepared for remaining lockdown restrictions to be lifted, both of which helped to prop up the Pound in an otherwise US holiday light session. Key standouts on Tuesday’s calendar come from the RBA policy decision, German factory orders, Eurozone construction PMIs, Eurozone retail sales, Eurozone and German ZEW sentiment reads, and US ISM non-manufacturing.USDJPY – technical overview
The major pair has run into massive resistance in the form of the monthly Ichimoku cloud. This translates to a longer-term trend that is still bearish despite the latest run higher. Look for additional upside to be limited, with scope for a topside failure and bearish resumption over the coming sessions. It would take a clear break back above 113.00 to negate the outlook.USDJPY – fundamental overview
The Yen was neither here nor there in a very light US holiday Monday trading sessions. Things are expected to pick up today and dealers have been talking about Yen demand in the aftermath of the latest slide. Key standouts on Tuesday’s calendar come from the RBA policy decision, German factory orders, Eurozone construction PMIs, Eurozone retail sales, Eurozone and German ZEW sentiment reads, and US ISM non-manufacturing.AUDUSD – technical overview
Technical studies have turned up in recent months, after the market traded down to its lowest levels since 2003 in 2020. There is evidence of a longer-term bottom following the latest push back through 0.7000, though at this stage, there is risk for a deeper pullback to allow for shorter term studies to unwind. Setbacks should now be well supported ahead of 0.7000.AUDUSD – fundamental overview
There's been talk of a potential extension of the lockdown in Sydney with cases still not back under control. Activity is expected to pick up in the market today, as the market digests the latest RBA decision and the US returns from holiday. Key standouts on Tuesday’s calendar come from the RBA policy decision, German factory orders, Eurozone construction PMIs, Eurozone retail sales, Eurozone and German ZEW sentiment reads, and US ISM non-manufacturing.USDCAD – technical overview
Has been in major decline since topping out in 2021 above 1.4600. At this stage, with the decline now well extended, the market is likely to find solid support into the 1.2000 area ahead of a resumption of gains. Ultimately, only a weekly close below 1.2000 would suggest otherwise. Back above 1.2500 will strengthen the outlook.USDCAD – fundamental overview
The Bank of Canada business outlook indicator rose, though with trading conditions so thin on Monday on account of the US holiday, we didn't see much in the way of price action. Key standouts on Tuesday’s calendar come from the RBA policy decision, German factory orders, Eurozone construction PMIs, Eurozone retail sales, Eurozone and German ZEW sentiment reads, and US ISM non-manufacturing.NZDUSD – technical overview
The market has been very well supported in recent months and there is evidence of a longer-term base. Look for setbacks to hold up above 0.6800, with sights set on a run back towards the 0.7500 area.NZDUSD – fundamental overview
The RBNZ purchased NZD 110 million of government bonds in Monday's QE operation, where decent offers were seen. New Zealand's June ANZ commodity price index rose 0.8% m/m versus an upwardly revised 2.1% m/m previous. However, it's worth noting that dairy prices were the only major category to fall. Trading conditions are expected to pick up on Tuesday as the US market returns from the holiday. Key standouts on Tuesday’s calendar come from the RBA policy decision, German factory orders, Eurozone construction PMIs, Eurozone retail sales, Eurozone and German ZEW sentiment reads, and US ISM non-manufacturing.US SPX 500 – technical overview
Longer-term technical studies are looking quite exhausted and the market is showing signs of wanting to roll over after racing to another record high. Look for rallies to be well capped ahead of 4400, with a break back below 4139 to strengthen the outlook.US SPX 500 – fundamental overview
We're trading just off fresh record highs, and yet, with so little room for additional central bank accommodation, given an already depressed interest rate environment, the prospect for sustainable runs to the topside on easy money policy incentives and government stimulus, should no longer be as enticing to investors. Meanwhile, ongoing worry associated with coronavirus fallout and risk of rising inflation should weigh more heavily on investor sentiment into the second half of 2021.GOLD (SPOT) – technical overview
The 2019 breakout above the 2016 high at 1375 was a significant development, opening the door for fresh record highs and an acceleration beyond the next major psychological barrier at 2000. Setbacks should now be well supported above 1600.GOLD (SPOT) – fundamental overview
The yellow metal continues to be well supported on dips with solid demand from medium and longer-term accounts. These players are more concerned about exhausted monetary policy, extended global equities, and coronavirus fallout. All of this should keep the commodity well supported, with many market participants also fleeing to the hard asset as the grand dichotomy of record high equities and record low yields comes to an unnerving climax.