


Today’s report: Month end flow playing into price action
Finally a little Dollar selling and equity market strength into Friday. But a lot of the talk around this price action has been associated with short-term activity and end of month flow.
Wake-up call
- inflation, GDP
- sluggish data
- policy stance
- rate outlook
- oil rebound
- macro drivers
- Stocks vulnerable
- Dealers report
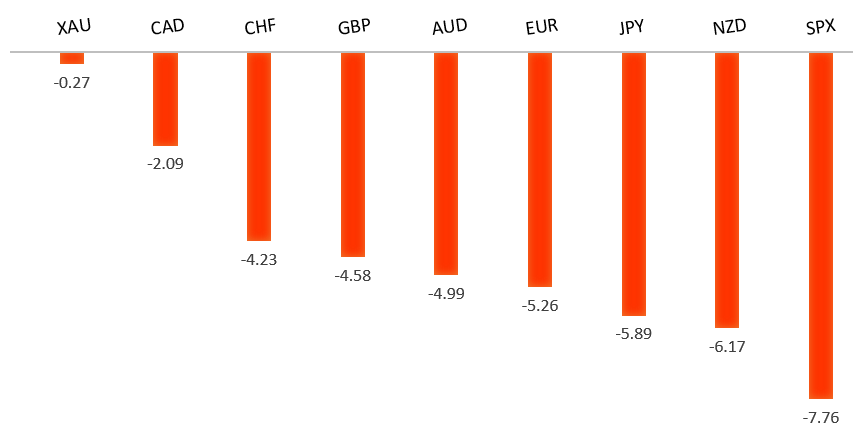
Peformance chart: 30 Day Performance vs. US dollar (%)
Suggested reading
- Looking for the Silver Linings in Shrinking GDP, J. Authers, Bloomberg (April 29, 2022)
- Belfast Tries to Heal a Legacy of Separation, J. Webber, Financial Times (April 29, 2022)
Chart talk: Technical & fundamental highlights
Choose pair:
EURUSD – technical overview
A recent breakdown below 1.1100 to fresh multi-month lows now sets up the next major downside extension towards the multi-year low from 2017 in the 1.0300 area. At this stage, it will take a push back above 1.1500 to force a shift in the outlook.EURUSD – fundamental overview
The Euro has traded down to a 5 year low on the back of ongoing stress around fallout from the Russia-Ukraine war, global growth concerns and yield differentials with the US Dollar. Key standouts on today’s calendar come in the form of German import prices, Eurozone inflation, German and Eurozone GDP, Canada GDP, and US reads highlighted by personal income and spending, core PCE, Chicago PMIs, and Michigan sentiment.EURUSD - Technical charts in detail
GBPUSD – technical overview
The market is in a correction phase in the aftermath of the run to fresh multi-month highs in 2021. At this stage, additional setbacks should be limited to the 1.2500 area ahead of the next major upside extension towards a retest and break of critical resistance in the form of the 2018 high. Back above 1.3148 takes immediate pressure off the downside.GBPUSD – fundamental overview
UK economic data has been awful of late. UK debt service and public sector wage costs have exploded, while April CBI monthly sales volume has crashed. BOE Bailey has been sounding less hawkish. And yield differentials continue to play into the Dollar's favor. Key standouts on today’s calendar come in the form of German import prices, Eurozone inflation, German and Eurozone GDP, Canada GDP, and US reads highlighted by personal income and spending, core PCE, Chicago PMIs, and Michigan sentiment.USDJPY – technical overview
The market has rocketed higher to its highest levels since 2002 after breaking through the 2015 high. Technical studies are however quite extended, with scope for a sizable correction in the weeks ahead. Look for additional upside from here to be limited to the 130.00 area for now.USDJPY – fundamental overview
The Yen continues to take its hits from the massive yield differential and monetary policy divergence between the BOJ and Fed, trading to its lowest levels against the Buck in 20 years. The BOJ has just left rates unchanged while maintaining accommodative policy and somewhat welcoming the weaker Yen. Key standouts on today’s calendar come in the form of German import prices, Eurozone inflation, German and Eurozone GDP, Canada GDP, and US reads highlighted by personal income and spending, core PCE, Chicago PMIs, and Michigan sentiment.AUDUSD – technical overview
At this stage, the market has found a bottom and is trying to work back to the topside. Still, the overall pressure remains on the downside and ultimately, it will take a weekly close back above 0.7600 to officially shift the focus back on the topside.AUDUSD – fundamental overview
The Australian Dollar has been mostly under pressure this week on the back of monetary policy divergence between the RBA and Fed and some risk off flow. But the market has been pricing a more aggressive rate hike path at the RBA and we are seeing some risk on flow into Friday which is propping the currency back up a bit. Hotter than expected Aussie producer prices have contributed to the more hawkish RBA repricing. Key standouts on today’s calendar come in the form of German import prices, Eurozone inflation, German and Eurozone GDP, Canada GDP, and US reads highlighted by personal income and spending, core PCE, Chicago PMIs, and Michigan sentiment.USDCAD – technical overview
Signs of a major bottom in the works after a severe decline from the 2020 high. A recent weekly close back above 1.2500 encourages the constructive outlook and opens the door for a push back towards next critical resistance in the 1.3000 area. Any setbacks should be well supported into the 1.2200s.USDCAD – fundamental overview
The Canadian Dollar has been in recovery mode in the latter half of the week, with a rebound in the price of oil and the return of risk on trade helping the Loonie. Meanwhile, talk out of the Bank of Canada continues to lean hawkish, yet another prop for the Loonie. Key standouts on today’s calendar come in the form of German import prices, Eurozone inflation, German and Eurozone GDP, Canada GDP, and US reads highlighted by personal income and spending, core PCE, Chicago PMIs, and Michigan sentiment.NZDUSD – technical overview
The market has been trending lower since topping out in 2021, making a series of lower highs and lower lows. Look for the latest recovery rally to set up the next lower top for a bearish continuation below 0.6500 and towards 0.6000. Back above 0.7200 would be required to negate and force a shift in the structure.NZDUSD – fundamental overview
The New Zealand Dollar has been unable to avoid downside pressure from a very clear yield differential advantage to the US Dollar, and from falling commodities prices. And despite some attempts at recovery in stocks, overall, sentiment has been weighed down as well, which has also been no help to the risk correlated commodity currency. We are however seeing a little bit of a relief rally into Friday. Key standouts on today’s calendar come in the form of German import prices, Eurozone inflation, German and Eurozone GDP, Canada GDP, and US reads highlighted by personal income and spending, core PCE, Chicago PMIs, and Michigan sentiment.US SPX 500 – technical overview
Longer-term technical studies are in the process of unwinding from extended readings off record highs. Look for rallies to be well capped in favor of lower tops and lower lows. Back above 4,700 will be required at a minimum to take the immediate pressure off the downside. Below 4105 opens next downside extension.US SPX 500 – fundamental overview
With so little room for additional central bank accommodation, given an already depressed interest rate environment, the prospect for sustainable runs to the topside on easy money policy incentives and government stimulus, should no longer be as enticing to investors. Meanwhile, ongoing worry associated with coronavirus fallout, rising inflation, and geopolitical tension should weigh more heavily on investor sentiment in Q2 2022.GOLD (SPOT) – technical overview
The 2019 breakout above the 2016 high at 1375 was a significant development, opening the door for fresh record highs. Setbacks should now be well supported above 1800.GOLD (SPOT) – fundamental overview
The yellow metal continues to be well supported on dips with solid demand from medium and longer-term accounts. These players are more concerned about exhausted monetary policy, extended global equities, coronavirus fallout, inflation risk, and geopolitical tension. All of this should keep the commodity well supported, with many market participants also fleeing to the hard asset as the grand dichotomy of record high equities and record low yields comes to an unnerving climax.