


Next 24 hours: Does this repricing have legs?
Today’s report: No major surprises from Fed Minutes
If the market was looking for signs of a less hawkish Fed in Wednesday’s Minutes, it was going to be let down. This was the message we delivered in our special report preview of the event risk and this is how things played out more or less.
Wake-up call
- less hawkish
- Euro outflows
- Upbeat data
- RMB breaks
- rate bets
- stalls out
- Stocks vulnerable
- Dealers report
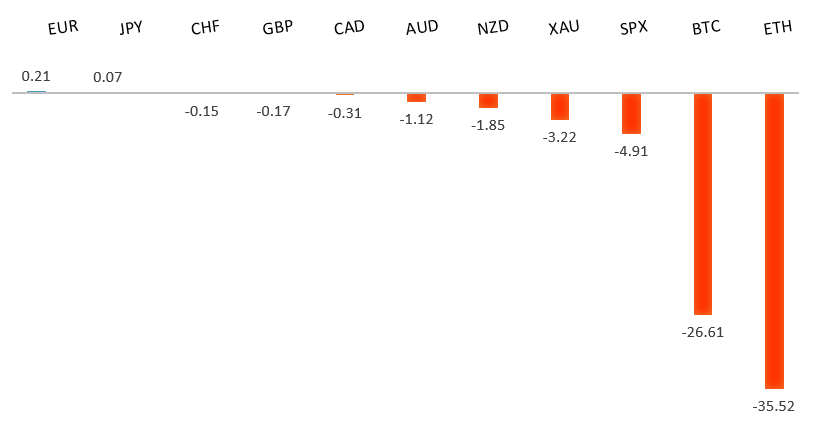
Peformance chart: 30 Day Performance vs. US dollar (%)
Suggested reading
- As Hedge Funds Stumble, Sorry Is the Hardest Word, C. Bryant, Bloomberg (May 26, 2022)
- General Stanley McChrystal’s Risk Management Lessons, A. Hill, US News (May 25, 2022)
Chart talk: Technical & fundamental highlights
Choose pair:
EURUSD – technical overview
The market has come under intense pressure in recent weeks, with setbacks accelerating to retest the multi-year low from 2017. A clear break below 1.0300 now sets up the next downside extension towards parity. At the same time, technical studies have been in the process of unwinding from oversold. But back above 1.1000 would be required at a minimum to take the immediate pressure off the downside.EURUSD – fundamental overview
The Euro has come back under pressure after a Wednesday lineup of ECB speak failed to make any mention of 50 bps rate hikes. We did however hear from ECB Panetta, who warned about emerging signs of economic stress. Key standouts on today’s calendar come from Canada retail sales, and US reads in the form of GDP, initial jobless claims, core PCE, and pending home sales.EURUSD - Technical charts in detail
GBPUSD – technical overview
The recent drop below 1.2500 has accelerated declines, with the market firmly focused on next key support in the form of the 2019 low around 1.1960. However, if indeed we do see a test of this level over the coming days, additional setbacks should be very well supported with technical studies highly extended and a bullish reversal anticipated. Back above 1.2640 will be required to take the immediate pressure off the downside.GBPUSD – fundamental overview
Most of the Pound outperformance in Wednesday trade was on account of Euro underperformance, with the UK currency benefitting from the less hawkish talk out from various ECB officials, which opened flow back into the Pound. Key standouts on today’s calendar come from Canada retail sales, and US reads in the form of GDP, initial jobless claims, core PCE, and pending home sales.USDJPY – technical overview
The market has rocketed higher to its highest levels since 2002 after breaking through the 2015 high. Technical studies are however in the process of unwinding from overbought readings, with scope for a sizable correction in the weeks ahead. Look for additional upside from here to be limited to the 130.00 area for now. A break back below 127.00 would confirm the likelihood of a deeper pullback.USDJPY – fundamental overview
We are finally seeing evidence of a Yen that has perhaps fallen a little too hard and fast on monetary policy divergence between the BOJ and Fed. Instead, recent price action suggests the Yen is still in demand on the back of traditional correlations with risk off flow. There has been a mild bout of Yen selling in recent session on account of rising energy prices and worsening terms of trade. Key standouts on today’s calendar come from Canada retail sales, and US reads in the form of GDP, initial jobless claims, core PCE, and pending home sales.AUDUSD – technical overview
The market has dropped back to a critical internal support level in the form of the 2016 low. A breakdown below this level would open the door for a bearish continuation towards 0.6000. Back above 0.7265 would be required to take the immediate pressure off the downside.AUDUSD – fundamental overview
The Australian Dollar traded lower on Wednesday as the RMB broke down. Pledges of government support from Chinese officials failed to sway investor sentiment. Meanwhile, a pullback in metals prices was also seen weighing. Key standouts on today’s calendar come from Canada retail sales, and US reads in the form of GDP, initial jobless claims, core PCE, and pending home sales.USDCAD – technical overview
The latest surge back above 1.3000 ends a period of bearish consolidation and suggests the market is in the process of carving out a more significant longer-term base. Next key resistance now comes in up into the 1.3500 area. Any setbacks should be very well supported down into the 1.2500 area.USDCAD – fundamental overview
The Canadian Dollar has been sold in recent sessions, though the price action is somewhat hard to reconcile given bid oil and higher stocks. We think it could have something to do with an unwinding of hawkish Bank of Canada bets in light of upgraded concerns about the overall growth outlook. Key standouts on today’s calendar come from Canada retail sales, and US reads in the form of GDP, initial jobless claims, core PCE, and pending home sales.NZDUSD – technical overview
The market has been trending lower since topping out in 2021, making a series of lower highs and lower lows. The focus is now squarely on a retest of the 2015 low which comes in just ahead of 0.6100. Back above 0.6570 would be required to take the immediate pressure off the downside.NZDUSD – fundamental overview
The New Zealand Dollar hasn't been able to do much with consecutive 50 bp hikes from the RBNZ. Stocks have also been in recovery mode and yet we're seeing more Kiwi selling into the rally. It seems bigger picture concerns around the global growth outlook are having a bigger impact at the moment. Key standouts on today’s calendar come from Canada retail sales, and US reads in the form of GDP, initial jobless claims, core PCE, and pending home sales.US SPX 500 – technical overview
Longer-term technical studies are in the process of unwinding from extended readings off record highs. Look for rallies to be well capped in favor of lower tops and lower lows. Back above 4,312 will be required at a minimum to take the immediate pressure off the downside. Next major support comes in around 3,400.US SPX 500 – fundamental overview
With so little room for additional central bank accommodation, given an already depressed interest rate environment, the prospect for sustainable runs to the topside on easy money policy incentives and government stimulus, should no longer be as enticing to investors. Meanwhile, ongoing worry associated with coronavirus fallout, rising inflation, and geopolitical tension should continue to weigh more heavily on investor sentiment in 2022.GOLD (SPOT) – technical overview
The 2019 breakout above the 2016 high at 1375 was a significant development, opening the door for fresh record highs. Setbacks should now be well supported above 1700.GOLD (SPOT) – fundamental overview
The yellow metal continues to be well supported on dips with solid demand from medium and longer-term accounts. These players are more concerned about exhausted monetary policy, extended global equities, coronavirus fallout, inflation risk, and geopolitical tension. All of this should keep the commodity well supported, with many market participants also fleeing to the hard asset as the grand dichotomy of record high equities and record low yields comes to an unnerving climax.