


Today’s report: Why today's job report matters
We’re back to the story of bad news being taken as good news by investors. The latest ADP miss out of the US has encouraged the stock market, with the data supporting the case that rates can’t be going much higher as it would stifle growth.
Wake-up call
- yields surge
- Relative weakness
- deflation worry
- more hikes
- hawkish talk
- NZDUSD Upbeat sentiment supports Kiwi
- Stocks vulnerable
- Dealers report
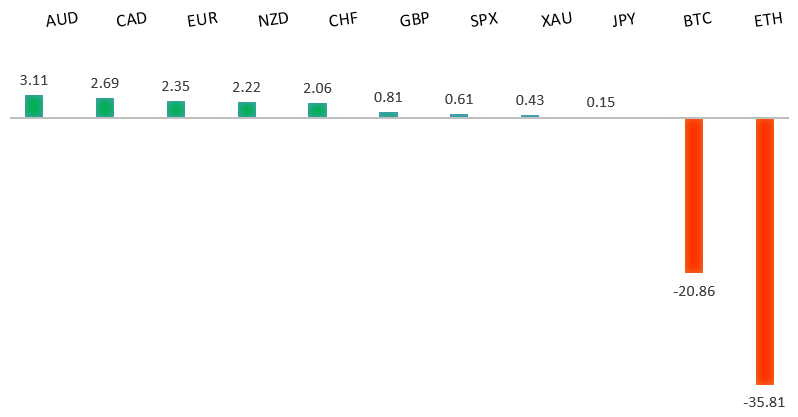
Peformance chart: 30 Day Performance vs. US dollar (%)
Suggested reading
- Bond Yields Are Signaling an Infeasible Compromise, J. Authers, Bloomberg (June 2, 2022)
- Crypto Just Had Its Lehman Moment. What’s Next?, E. Robinson, Institutional Investor (June 1, 2022)
Chart talk: Technical & fundamental highlights
Choose pair:
EURUSD – technical overview
The market has come under intense pressure in recent weeks, with setbacks accelerating to retest the multi-year low from 2017. A clear break below 1.0300 now sets up the next downside extension towards parity. At the same time, technical studies have been in the process of unwinding from oversold. But back above 1.1000 would be required at a minimum to take the immediate pressure off the downside.EURUSD – fundamental overview
The Euro was back on the bid in Thursday trade as European yields surged and Eurozone producer prices topped 37%. Meanwhile, a softer US ADP number had many traders selling US Dollars on worry over the implication for today's US jobs report. Key standouts on today’s calendar come from German trade, German and Eurozone PMI reads, the monthly employment report out of the US, and US ISM non-manufacturing.EURUSD - Technical charts in detail
GBPUSD – technical overview
The market continues to be exceptionally well supported on dips down into the 1.2000 area, with the latest setback once again holding up ahead of the barrier. Overall, the daily trend remains bearish, though there are signs of the market wanting to put in a meaningful bottom ahead of the next major upside extension. Look for a clear break back above 1.3000 to strengthen this outlook.GBPUSD – fundamental overview
Most of the latest demand for the Pound comes from US Dollar outflows on the back of the latest soft US ADP number. Trading conditions have been lighter in the UK on account of the Queen's holiday. We've also seen some relative underperformance in the Pound relative to other currencies, this on a more downbeat outlook for the UK economy and a possible need to reprice hawkish expectations. Key standouts on today’s calendar come from German trade, German and Eurozone PMI reads, the monthly employment report out of the US, and US ISM non-manufacturing.USDJPY – technical overview
The market has rocketed higher to its highest levels since 2002 after breaking through the 2015 high. Technical studies are however in the process of unwinding from overbought readings, with scope for a sizable correction in the weeks ahead. Look for additional upside from here to be limited to the 130.00 area for now. A break back below 127.00 would confirm the likelihood of a deeper pullback.USDJPY – fundamental overview
Policy divergence is playing back into the picture over the last couple of sessions, with market participants once again focusing on yield differentials that continue to weigh heavily in the US Dollar's favor. The BOJ is clearly still more worried about deflation than inflation. Key standouts on today’s calendar come from German trade, German and Eurozone PMI reads, the monthly employment report out of the US, and US ISM non-manufacturing.AUDUSD – technical overview
The market has been in recovery mode since bottoming out off the yearly low. Overall however, conditions remain quite choppy, and while the short-term pressure has been taken off the downside, rallies towards 0.7500 should be very well offered.AUDUSD – fundamental overview
It's seems Aussie traders have taken their cues from this week's hawkish Bank of Canada decision and are now pricing in more hikes ahead of next week's RBA meeting. Rallying metals prices and more positive news out of China around government support and lower COVID cases have also been helping the Aussie recovery. The Aussie trade surplus has widened out. Iron ore exports are up 2.6%. Coal exports are up 6.1%. Key standouts on today’s calendar come from German trade, German and Eurozone PMI reads, the monthly employment report out of the US, and US ISM non-manufacturing.USDCAD – technical overview
A recent surge back above 1.3000 signals an end to a period of bearish consolidation and suggests the market is in the process of carving out a more significant longer-term base. Next key resistance now comes in up into the 1.3500 area. Setbacks should be very well supported down into the 1.2500 area.USDCAD – fundamental overview
The Canadian Dollar is pressing higher in the aftermath of this week's 50 basis point rate hike from the Bank of Canada. More hawkish talk out from BoC officials in the aftermath of the decision has been helping to fuel the additional gains. Key standouts on today’s calendar come from German trade, German and Eurozone PMI reads, the monthly employment report out of the US, and US ISM non-manufacturing.NZDUSD – technical overview
The market has been in recovery mode since bottoming out off the yearly low. Overall however, conditions remain quite choppy, and while the short-term pressure has been taken off the downside, rallies should be very well offered.NZDUSD – fundamental overview
We're seeing more demand for the New Zealand Dollar into the end of the week, with the currency getting help from broad based US Dollar outflows and higher stocks. Key standouts on today’s calendar come from German trade, German and Eurozone PMI reads, the monthly employment report out of the US, and US ISM non-manufacturing.US SPX 500 – technical overview
Longer-term technical studies are in the process of unwinding from extended readings off record highs. Look for rallies to be well capped in favor of lower tops and lower lows. Back above 4,312 will be required at a minimum to take the immediate pressure off the downside. Next major support comes in around 3,400.US SPX 500 – fundamental overview
With so little room for additional central bank accommodation, given an already depressed interest rate environment, the prospect for sustainable runs to the topside on easy money policy incentives and government stimulus, should no longer be as enticing to investors. Meanwhile, ongoing worry associated with coronavirus fallout, rising inflation, and geopolitical tension should continue to weigh more heavily on investor sentiment in 2022.GOLD (SPOT) – technical overview
The 2019 breakout above the 2016 high at 1375 was a significant development, opening the door for fresh record highs. Setbacks should now be well supported above 1700.GOLD (SPOT) – fundamental overview
The yellow metal continues to be well supported on dips with solid demand from medium and longer-term accounts. These players are more concerned about exhausted monetary policy, extended global equities, coronavirus fallout, inflation risk, and geopolitical tension. All of this should keep the commodity well supported, with many market participants also fleeing to the hard asset as the grand dichotomy of record high equities and record low yields comes to an unnerving climax.