


Today’s report: Currencies lower against Buck despite hawkish CBs
We’re starting to see a pattern of central banks responding with a shift in policy to the hawkish side, in response to rapidly rising inflation. The interesting thing about this is that none of it is doing much to support these currencies.
Wake-up call
- hawkish ECB
- hike pricing
- easy policy
- RBA outlook
- Canada employment
- Slumping sentiment
- Stocks vulnerable
- Dealers report
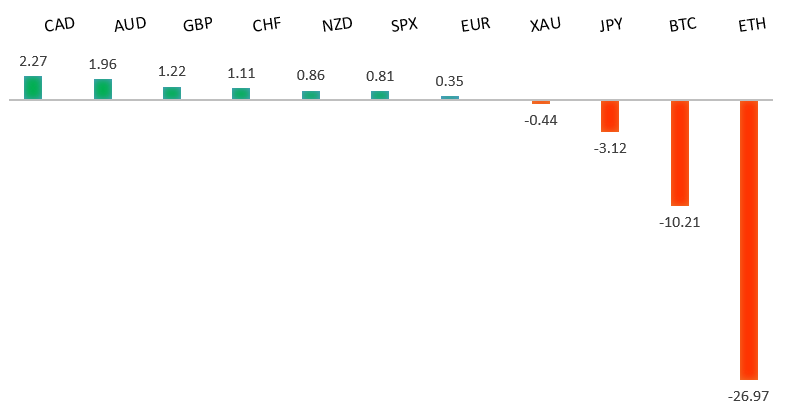
Peformance chart: 30 Day Performance vs. US dollar (%)
Suggested reading
- Don’t Be Fooled by Conflicting Inflation Metrics. The Fed Won’t, J. Levin, Bloomberg (June 9, 2022)
- Can We Save the World's Forests?, C. Hodgson, Financial Times (June 9, 2022)
Chart talk: Technical & fundamental highlights
Choose pair:
EURUSD – technical overview
The market has come under intense pressure in recent weeks, with setbacks accelerating to retest the multi-year low from 2017. A clear break below 1.0300 now sets up the next downside extension towards parity. At the same time, technical studies have been in the process of unwinding from oversold. But back above 1.1000 would be required at a minimum to take the immediate pressure off the downside.EURUSD – fundamental overview
The Euro has come under pressure in the aftermath of the ECB decision in which the central bank laid out its tightening plan and end of QE. The central bank also upped its inflation forecasts, with the rate market pricing 140 bps of hikes by year end. But the impact here is net bearish as far as the strain on the economy goes, which has opened downside pressure despite the yield. Key standouts on Friday’s calendar come from Canada employment, US inflation, and Michigan sentiment.EURUSD - Technical charts in detail
GBPUSD – technical overview
The market continues to be exceptionally well supported on dips down into the 1.2000 area, with the latest setback once again holding up ahead of the barrier. Overall, the daily trend remains bearish, though there are signs of the market wanting to put in a meaningful bottom ahead of the next major upside extension. Look for a clear break back above 1.3000 to strengthen this outlook.GBPUSD – fundamental overview
UK money markets have advanced BOE rate hike pricing, which has helped to provide some support for the Pound into dips. The market is looking for 100 bps of hikes through September, and another 100 bps by May 2023. Key standouts on Friday’s calendar come from Canada employment, US inflation, and Michigan sentiment.USDJPY – technical overview
The market has rocketed higher to its highest levels since 2002 after breaking through the 2015 high. Technical studies are however looking stretched, with scope for a sizable consolidation and correction in the weeks ahead. Look for additional upside from here to be limited to the 2002 high 135.00 area. A break back below 130.00 would take the immediate pressure off the topside.USDJPY – fundamental overview
Policy divergence continues to play a strong hand here, with market participants once again focusing on yield differentials that weigh heavily in the US Dollar's favor. The BOJ is clearly still committed to easy policy despite what's going on with other major central banks and the impact on the Yen, now at a 20 year low against the Buck. Key standouts on Friday’s calendar come from Canada employment, US inflation, and Michigan sentiment.AUDUSD – technical overview
The market has been in recovery mode since bottoming out off the yearly low. Overall however, conditions remain quite choppy, and while the short-term pressure has been taken off the downside, rallies should be very well offered.AUDUSD – fundamental overview
There Australian Dollar hasn't been able to do anything with this week's 50 basis point RBA rate hike and accompanying hawkish communication. Instead, the currency has been weighed down by the broader reduction in global risk sentiment and expectations for higher rates in the US. Key standouts on Friday’s calendar come from Canada employment, US inflation, and Michigan sentiment.USDCAD – technical overview
A recent surge back above 1.3000 signals an end to a period of bearish consolidation and suggests the market is in the process of carving out a more significant longer-term base. Next key resistance now comes in up into the 1.3500 area. Setbacks should be very well supported down into the 1.2500 area.USDCAD – fundamental overview
We have seen weakness in the Loonie into the latter half of the week on account of global risk liquidation and some setbacks in the price of oil. Key standouts on Friday’s calendar come from Canada employment, US inflation, and Michigan sentiment.NZDUSD – technical overview
The market has been in recovery mode since bottoming out off the yearly low. Overall however, conditions remain quite choppy, and while the short-term pressure has been taken off the downside, rallies should be very well offered.NZDUSD – fundamental overview
Broad based risk off flow has resulted in renewed downside pressure in the New Zealand Dollar. Not helping matters either is a softer round of data out of New Zealand this week. Key standouts on Friday’s calendar come from Canada employment, US inflation, and Michigan sentiment.US SPX 500 – technical overview
Longer-term technical studies are in the process of unwinding from extended readings off record highs. Look for rallies to be well capped in favor of lower tops and lower lows. Back above 4,312 will be required at a minimum to take the immediate pressure off the downside. Next major support comes in around 3,400.US SPX 500 – fundamental overview
With so little room for additional central bank accommodation, given an already depressed interest rate environment, the prospect for sustainable runs to the topside on easy money policy incentives and government stimulus, should no longer be as enticing to investors. Meanwhile, ongoing worry associated with coronavirus fallout, rising inflation, and geopolitical tension should continue to weigh more heavily on investor sentiment in 2022.GOLD (SPOT) – technical overview
The 2019 breakout above the 2016 high at 1375 was a significant development, opening the door for fresh record highs. Setbacks should now be well supported above 1700.GOLD (SPOT) – fundamental overview
The yellow metal continues to be well supported on dips with solid demand from medium and longer-term accounts. These players are more concerned about exhausted monetary policy, extended global equities, coronavirus fallout, inflation risk, and geopolitical tension. All of this should keep the commodity well supported, with many market participants also fleeing to the hard asset as the grand dichotomy of record high equities and record low yields comes to an unnerving climax.