


Next 24 hours: US Dollar continues to run hot
Today’s report: Currencies more worried than stocks
It was hard for the market to ignore all of the fallout in China on Monday, this after China economic data disappointed and the PBOC stepped in with an interest rate cut. The net result was somewhat mixed.
Wake-up call
- Energy crisis
- Labor shortages
- haven bids
- RBA repricing
- Canada inflation
- commodities decline
- Inflation headache
- Dealers report
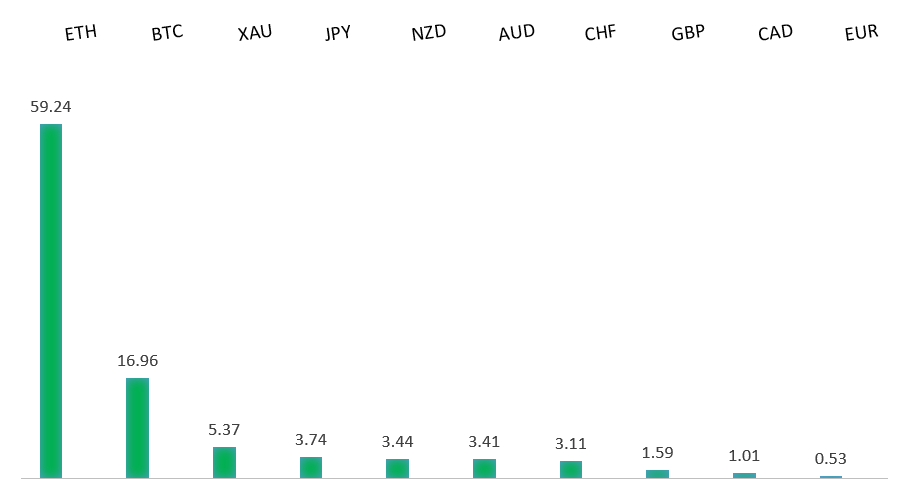
Peformance chart: 30 Day Performance vs. US dollar (%)
Suggested reading
- ‘The End of the Beginning’ of This War on Inflation, J. Authers, Bloomberg (August 15, 2022)
- Controversy Clouds US Solar Development, J. Jacobs, Financial Times (August 14, 2022)
Chart talk: Technical & fundamental highlights
Choose pair:
EURUSD – technical overview
The market has come under intense pressure in recent months, with setbacks accelerating below the critical multi-year low from 2017 at 1.0340. This sets up a test of monumental support in the form of parity. At the same time, technical studies are tracking in oversold territory, suggesting additional setbacks should be limited. Back above 1.0500 would be required to take the immediate pressure off the downside.EURUSD – fundamental overview
The Euro was under pressure on Monday, this on the back of headlines dominated by a looming energy crisis. Key standouts on Tuesday’s calendar come from UK employment data, Eurozone trade, Eurozone and German ZEW reads, Canada inflation, US housing starts and building permits, and US industrial and manufacturing production.EURUSD - Technical charts in detail
GBPUSD – technical overview
The market continues to be exceptionally well supported on dips below 1.2000. Unless we see a monthly close below 1.2000, we expect this to continue to be the case. Look for this latest break back above 1.2200 to strengthen the case for the establishment of a meaningful base.GBPUSD – fundamental overview
The Pound was knocked back for a third day as labor shortages commanded most of the attention. Heathrow has extended a 100k passenger cap to October 29th due to worker shortage, while GBP 60 million of food rots in fields. Key standouts on Tuesday’s calendar come from UK employment data, Eurozone trade, Eurozone and German ZEW reads, Canada inflation, US housing starts and building permits, and US industrial and manufacturing production.USDJPY – technical overview
Technical studies are in the process of unwinding, with scope for additional correction in the days and weeks ahead. Look for additional upside from here to be well capped. Next key support comes in at 130.00.USDJPY – fundamental overview
The Yen was mildly bid in Monday trade despite broad based US Dollar demand. The price action was attributed to haven bid from worry over a potential breakdown in the RMB, and to rising inflation pressures as reflected in Japanese GDP data. Key standouts on Tuesday’s calendar come from UK employment data, Eurozone trade, Eurozone and German ZEW reads, Canada inflation, US housing starts and building permits, and US industrial and manufacturing production.AUDUSD – technical overview
Overall pressure remains on the downside despite the recent recovery and conditions remain quite choppy. A break back above 0.7284 would be required to take the pressure off the downside. Until then, scope exists for a lower top below 0.7284 and deeper setbacks towards 0.6500.AUDUSD – fundamental overview
The Australian Dollar was hit hard in Monday trade, suffering from weak China data and a decline in metals prices. This has resulted in a repricing in RBA rate hike expectations from 50 basis points to 25 basis points. Key standouts on Tuesday’s calendar come from UK employment data, Eurozone trade, Eurozone and German ZEW reads, Canada inflation, US housing starts and building permits, and US industrial and manufacturing production.USDCAD – technical overview
A recent surge back above 1.3000 signals an end to a period of bearish consolidation and suggests the market is in the process of carving out a more significant longer-term base. Next key resistance now comes in up into the 1.3500 area. Setbacks should be very well supported down into the 1.2500 area.USDCAD – fundamental overview
The Canadian Dollar was under intense pressure on Monday, taking a hit from softer economic data as reflected through home prices and manufacturing sales, while also getting hit from heavy setbacks in the price of oil. Key standouts on Tuesday’s calendar come from UK employment data, Eurozone trade, Eurozone and German ZEW reads, Canada inflation, US housing starts and building permits, and US industrial and manufacturing production.NZDUSD – technical overview
Overall pressure remains on the downside despite the recent recovery and conditions remain quite choppy. A break back above 0.6577 would be required to take the pressure off the downside. Until then, scope exists for a lower top below 0.6577 and deeper setbacks below 0.6000.NZDUSD – fundamental overview
The New Zealand Dollar couldn't help but feel the pressure from the bearish sentiment towards the China outlook, with the currency coming under pressure in Monday trade. Of course, a concurrent pullback in commodities was also a factor. Key standouts on Tuesday’s calendar come from UK employment data, Eurozone trade, Eurozone and German ZEW reads, Canada inflation, US housing starts and building permits, and US industrial and manufacturing production.US SPX 500 – technical overview
Longer-term technical studies are in the process of unwinding from extended readings off record highs. Look for rallies to be well capped in favor of lower tops and lower lows. Back above 4,310 will be required at a minimum to take the immediate pressure off the downside. Next major support comes in around 3,400.US SPX 500 – fundamental overview
We've finally reached a point in the cycle where the Fed recognizes unanchored inflation expectations pose a greater downside risk than over-tightening. This is significant, as it means less investor friendly monetary policy that risks potential recession in the months ahead. We have seen an attempt at recovery in recent weeks, with softer CPI reads helping. But overall, we expect inflation to continue to be a problem that results in renewed downside pressure into rallies.GOLD (SPOT) – technical overview
The 2019 breakout above the 2016 high at 1375 was a significant development, opening the door for fresh record highs. Setbacks should now be well supported above 1700 on a monthly close basis.GOLD (SPOT) – fundamental overview
The yellow metal continues to be well supported on dips with solid demand from medium and longer-term accounts. These players are more concerned about inflation risk and a less upbeat global growth outlook. All of this should keep the commodity well supported, with many market participants also fleeing to the hard asset as the grand dichotomy of record high equities and record low yields comes to an unnerving climax.