


Special report: ECB Decision Preview
Today’s report: Will the recovery rally hold up?
There’s been some relief into Thursday. We’ve seen profit taking on long US Dollar exposure and a healthy recovery in US equities. It seems there are a number of factors at play.
Wake-up call
- ECB decision
- energy bill
- Verbal intervention
- GDP
- rate hike
- risk sentiment
- Inflation headache
- Dealers report
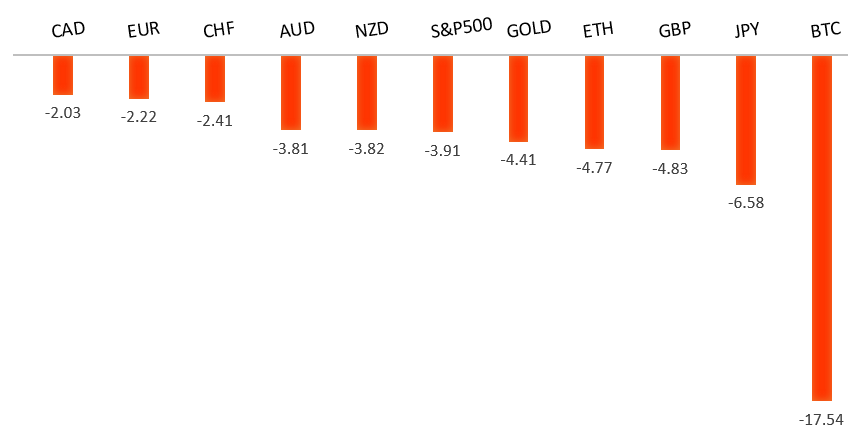
Peformance chart: 30 Day Performance vs. US dollar (%)
Suggested reading
- Markets Best Keep Their Bullish Impulses in Check, J. Levin, Bloomberg (September 5, 2022)
- Why We Need A Wealth Tax, M. Sandbu, Financial Times (September 6, 2022)
Chart talk: Technical & fundamental highlights
Choose pair:
EURUSD – technical overview
The market has come under intense pressure in recent months, with setbacks accelerating below the critical multi-year low from 2017 at 1.0340. This has set up a dip below monumental support in the form of parity. At the same time, technical studies are tracking in oversold territory, suggesting additional setbacks should be limited. Back above 1.0500 would be required to take the immediate pressure off the downside.EURUSD – fundamental overview
The Euro has caught a bid tone into Thursday, with the single currency getting help from a better than expected Eurozone GDP print and some position adjusting ahead of today's ECB event risk. Key standouts on Thursday’s calendar come from the ECB policy decision, US initial jobless claims, and a Fed Powell speech.EURUSD - Technical charts in detail
GBPUSD – technical overview
The market continues to be exceptionally well supported on dips below 1.2000. At the same time, there is now risk for a retest of the multi-year low from 2020 down in the 1.1400 area before we see the formation of a base and the next big push back through 1.2000. Back above 1.1761 takes the immediate pressure off the downside.GBPUSD – fundamental overview
On Wednesday, the Pound sunk to its lowest level since 1985, this after just taking out the low from 2020. The UK currency came under added pressure on some dovish and downbeat speak out from BOE members, and on heavy criticism around the proposed energy bill plan, which was estimated to cost more than the COVID job furlough scheme. We did however see some demand into the dip, this on broad based profit taking on US Dollar longs as US equities managed to put in a recovery. Key standouts on Thursday’s calendar come from the ECB policy decision, US initial jobless claims, and a Fed Powell speech.USDJPY – technical overview
Technical studies are looking quite stretched on the longer-term chart, warning of consolidation and correction in the days and weeks ahead. Look for additional upside from here to be well capped into the 145.00 area. Next key support comes in at 140.25.USDJPY – fundamental overview
Yield differentials between the Yen and US Dollar have resulted in a massive downturn in the Yen in 2022, with the currency at its lowest levels since 1998. In recent sessions, we have seen verbal intervention attempts on behalf of Japanese officials. But these attempts have mostly fallen on deaf ears. Key standouts on Thursday’s calendar come from the ECB policy decision, US initial jobless claims, and a Fed Powell speech.AUDUSD – technical overview
Overall pressure remains on the downside despite the recent recovery and conditions remain quite choppy. A break back above 0.7137 would be required to take the pressure off the downside. Until then, scope exists for a lower top below 0.7284 and deeper setbacks towards 0.6500.AUDUSD – fundamental overview
Australia GDP reads came in better than expected this week, and US equities have managed to put in a recovery. All of this has helped to inspire a recovery in the Australian Dollar out from recent lows. Key standouts on Thursday’s calendar come from the ECB policy decision, US initial jobless claims, and a Fed Powell speech.USDCAD – technical overview
A recent surge back above 1.3000 signals an end to a period of bearish consolidation and suggests the market is in the process of carving out a more significant longer-term base. Next key resistance now comes in up into the 1.3500 area. Setbacks should be very well supported down into the 1.2500 area.USDCAD – fundamental overview
The Bank of Canada went ahead and raised rates as widely expected by another 75 basis points. But the fact that this was all but priced in and hints at the central bank nearing the end of the rate hike cycle, prevented the currency from rallying all that much. Instead, most of the Wednesday Canadian Dollar upside was driven off broad based profit taking on US Dollar longs and a recovery in US stocks. Key standouts on Thursday’s calendar come from the ECB policy decision, US initial jobless claims, and a Fed Powell speech.NZDUSD – technical overview
Overall pressure remains on the downside despite the recent recovery and conditions remain quite choppy. A break back above 0.6251 would be required to take the pressure off the downside. Until then, scope exists for deeper setbacks towards 0.5500.NZDUSD – fundamental overview
A round of profit taking on US Dollar longs and a recovery in US equities have helped to inspire a well needed bounce in the New Zealand Dollar out from a fresh yearly low. Key standouts on Thursday’s calendar come from the ECB policy decision, US initial jobless claims, and a Fed Powell speech.US SPX 500 – technical overview
Longer-term technical studies are in the process of unwinding from extended readings off record highs. Look for rallies to be well capped in favor of lower tops and lower lows. Back above 4,328 will be required at a minimum to take the immediate pressure off the downside. Next major support comes in around 3,400.US SPX 500 – fundamental overview
We've finally reached a point in the cycle where the Fed recognizes unanchored inflation expectations pose a greater downside risk than over-tightening. This is significant, as it means less investor friendly monetary policy that risks potential recession in the months ahead. We have seen an attempt at recovery in recent weeks, with softer CPI reads helping. But overall, we expect inflation to continue to be a problem that results in renewed downside pressure into rallies.GOLD (SPOT) – technical overview
The 2019 breakout above the 2016 high at 1375 was a significant development, opening the door for fresh record highs. Setbacks should now be well supported above 1700 on a monthly close basis.GOLD (SPOT) – fundamental overview
The yellow metal continues to be well supported on dips with solid demand from medium and longer-term accounts. These players are more concerned about inflation risk and a less upbeat global growth outlook. All of this should keep the commodity well supported, with many market participants also fleeing to the hard asset as the grand dichotomy of record high equities and record low yields comes to an unnerving climax.