


Today’s report: Fed hawks still winning out
There’s been a lot of back and forth when it comes to Fed rhetoric, though for the most part, that rhetoric has been hawkish. Fed Bullard was the latest hawk to flex his views, after invoking the Taylor Rule, saying rates belonged between 5-7%.
Wake-up call
- ECB lacks
- Downbeat outlook
- trade deficit
- Rate market
- USDCAD Lower oil weighs on Canadian Dollar
- Farm expense
- Inflation headache
- Dealers report
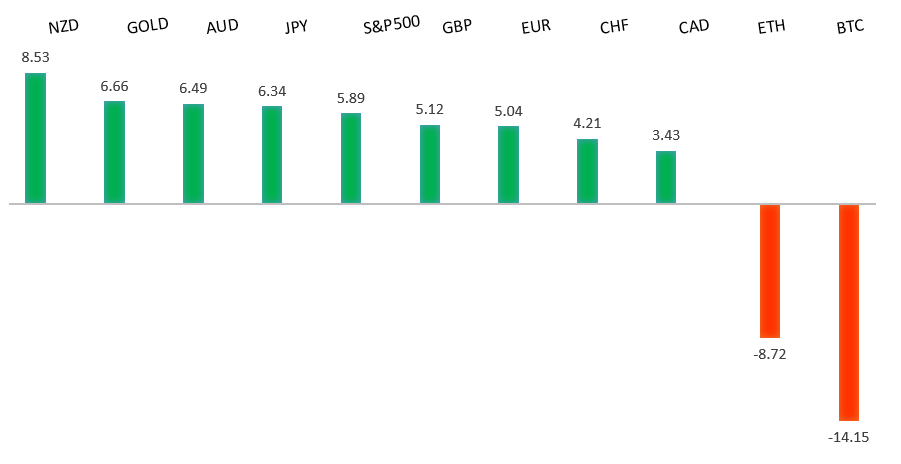
Peformance chart: 30 Day Performance vs. US dollar (%)
Suggested reading
- The World Economy Catches Some Lucky Breaks, D. Moss, Bloomberg (November 18, 2022)
- Early Lessons for Investors from FTX’s Collapse, E. Delinger, Fisher Investments (November 16, 2022)
Chart talk: Technical & fundamental highlights
Choose pair:
EURUSD – technical overview
A break back above important resistance at 1.0200 suggests the market could be in the process of carving out a longer-term base after sinking to a multi-year low. Look for any setbacks to now be well supported ahead of 0.9900, with only a break back below 0.9730 to compromise the shifting outlook. Next key resistance comes in by previous support at 1.0636.EURUSD – fundamental overview
Eurozone inflation came out softer than many had been thinking, while sources reported the ECB was lacking support for a more aggressive 75 basis point rate hike. Key standouts on Friday’s calendar come from UK retail sales, an ECB Lagarde speech, Canada producer prices, US existing home sales, and some Fed speak.EURUSD - Technical charts in detail
GBPUSD – technical overview
Signs have emerged of the market wanting to put in a longer-term base after collapsing to a record low in September. The latest weekly close back above the September high at 1.1739 strengthens this prospect. Any setbacks should now be well supported ahead of 1.1100. Next key resistance comes in at 1.2294.GBPUSD – fundamental overview
A grim outlook for the UK budget statement was behind a lot of the recent run of weakness in the Pound. At the same time, higher inflation reads have been supportive into dips given the pressure it puts for higher rates. Key standouts on Friday’s calendar come from UK retail sales, an ECB Lagarde speech, Canada producer prices, US existing home sales, and some Fed speak.USDJPY – technical overview
Longer-term technical studies are in the process of unwinding from severe overbought readings. Look for additional corrective price action back down towards the 130.00 area before the market considers the possibility of uptrend resumption. Rallies should now be well capped ahead of 147.00.USDJPY – fundamental overview
The Yen came under some pressure on reports of a wider trade deficit in Japan. At the same time, we also saw an across the board resurgence in US Dollar demand. Key standouts on Friday’s calendar come from UK retail sales, an ECB Lagarde speech, Canada producer prices, US existing home sales, and some Fed speak.AUDUSD – technical overview
There are signs of the potential formation of a longer-term base following the recent surge back above 0.6500. The latest weekly close back above previous support now turned resistance at 0.6682 strengthens the outlook for a bullish structural shift.AUDUSD – fundamental overview
The Australian Dollar wasn't able to do much with a solid employment report, instead getting sold on a downturn in Chinese markets. The local rate market has been reluctant to discount a 50 bps rate hike at the next meeting and is still leaning to 25 bps. Key standouts on Friday’s calendar come from UK retail sales, an ECB Lagarde speech, Canada producer prices, US existing home sales, and some Fed speak.USDCAD – technical overview
A recent surge back above 1.3000 signals an end to a period of bearish consolidation and suggests the market is in the process of carving out a more significant longer-term base. Next key resistance now comes in up into the 1.4000 area. Setbacks should be very well supported down into the 1.3000 area.USDCAD – fundamental overview
The Canadian Dollar was a little softer on Thursday, mostly on the back of lower oil prices. There was however some offsetting flow on the view that the Bank of Canada will keep hiking rates. Key standouts on Friday’s calendar come from UK retail sales, an ECB Lagarde speech, Canada producer prices, US existing home sales, and some Fed speak.NZDUSD – technical overview
Overall pressure remains on the downside with risk for the current recovery rally to stall out and form a lower top for the next major downside extension. A break back above 0.6251 would be required to take the immediate pressure off the downside.NZDUSD – fundamental overview
New Zealand farm expense prices have risen to a 29-year high, keeping pressure on the RBNZ to keep raising rates. Key standouts on Friday’s calendar come from UK retail sales, an ECB Lagarde speech, Canada producer prices, US existing home sales, and some Fed speak.US SPX 500 – technical overview
Longer-term technical studies are in the process of unwinding from extended readings off record highs. Look for rallies to be well capped in favor of lower tops and lower lows. A monthly close back above 4000 will be required at a minimum to take the immediate pressure off the downside. Next major support comes in around 3200.US SPX 500 – fundamental overview
We've finally reached a point in the cycle where the Fed recognizes unanchored inflation expectations pose a greater downside risk than over-tightening. This is significant, as it means less investor friendly monetary policy that risks potential recession in the months ahead. Overall, we expect inflation to continue to be a problem in Q4 2022 and Q1 2023 that results in downside pressure into rallies.GOLD (SPOT) – technical overview
The 2019 breakout above the 2016 high at 1375 was a significant development, opening the door for fresh record highs. Setbacks should now be well supported above 1600 on a monthly close basis ahead of the next major upside extension. Back above 1808 will strengthen the bullish outlook.GOLD (SPOT) – fundamental overview
The yellow metal continues to be well supported on dips with solid demand from medium and longer-term accounts. These players are more concerned about inflation risk and a less upbeat global growth outlook. All of this should keep the commodity well supported, with many market participants also fleeing to the hard asset as the grand dichotomy of record high equities and record low yields comes to an unnerving climax.