


Next 24 hours: Euro extends run after slow start
Today’s report: US market returns from holiday
We get back to fuller trade on this Monday, with the US market returning from the Thanksgiving holiday break. As things stand, the mood is leaning to the downbeat side, albeit mildly, with US equity futures pointing lower and the US Dollar broadly in demand.
Wake-up call
- ECB Lagarde
- PPI data
- inflation data
- retail sales
- Oil weakness
- NZDUSD Risk off flow weighs on Kiwi
- Inflation headache
- Dealers report
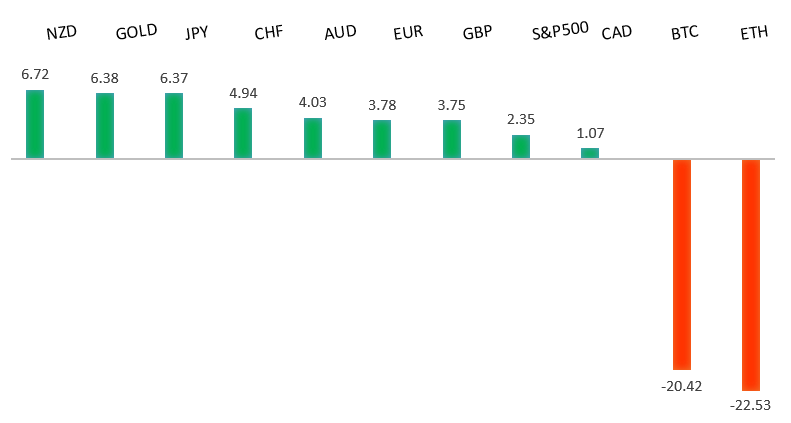
Peformance chart: 30 Day Performance vs. US dollar (%)
Suggested reading
- Putin's Few Oil Buyers Demand Deep Discounts, J. Lee, Bloomberg (November 27, 2022)
- Why Did Carlyle’s CEO Resign?, A. Gara, Financial Times (November 28, 2022)
Chart talk: Technical & fundamental highlights
Choose pair:
EURUSD – technical overview
A break back above important resistance at 1.0200 suggests the market could be in the process of carving out a longer-term base after sinking to a multi-year low. Look for any setbacks to now be well supported ahead of 0.9900, with only a break back below 0.9730 to compromise the shifting outlook. Next key resistance comes in by previous support at 1.0636.EURUSD – fundamental overview
The Euro came under some pressure at the end of last week after the PBOC cut the RRR. But overall, setbacks have been supported on better data out of the zone and more hawkish leaning ECB speak. Key standouts on Monday’s calendar come from Eurozone money supply, UK CBI trades, an ECB Lagarde speech, Dallas Fed manufacturing, and a Fed Williams speech.EURUSD - Technical charts in detail
GBPUSD – technical overview
Signs have emerged of the market wanting to put in a longer-term base after collapsing to a record low in September. The latest weekly close back above the September high at 1.1739 strengthens this prospect. Any setbacks should now be well supported ahead of 1.1100. Next key resistance comes in at 1.2294.GBPUSD – fundamental overview
The UK's ONS issued revisions to its PPI data after it found an error, and annual PPI output inflation for Jan-Oct 2022 was up by average of 1.8%. Key standouts on Monday’s calendar come from Eurozone money supply, UK CBI trades, an ECB Lagarde speech, Dallas Fed manufacturing, and a Fed Williams speech.USDJPY – technical overview
Longer-term technical studies are in the process of unwinding from severe overbought readings. Look for additional corrective price action back down towards the 130.00 area before the market considers the possibility of uptrend resumption. Rallies should now be well capped ahead of 147.00.USDJPY – fundamental overview
The Yen has been better bid in recent sessions, getting a boost from the combination of hotter Japan inflation data, more dovish leaning Fed speak, and renewed risk off flow. Key standouts on Monday’s calendar come from Eurozone money supply, UK CBI trades, an ECB Lagarde speech, Dallas Fed manufacturing, and a Fed Williams speech.AUDUSD – technical overview
There are signs of the potential formation of a longer-term base following the recent surge back above 0.6500. The latest weekly close back above previous support now turned resistance at 0.6682 strengthens the outlook for a bullish structural shift.AUDUSD – fundamental overview
The Australian Dollar has taken a hit on Monday after Aussie retail sales came in much weaker than expected. Perhaps offsetting some of the downside pressure was RBA Lowe, who said Australia has a stronger probability of bringing its economy in for a “soft landing” than almost any other developed-world counterpart, citing the nation's still-contained wage growth. Key standouts on Monday’s calendar come from Eurozone money supply, UK CBI trades, an ECB Lagarde speech, Dallas Fed manufacturing, and a Fed Williams speech.USDCAD – technical overview
A recent surge back above 1.3000 signals an end to a period of bearish consolidation and suggests the market is in the process of carving out a more significant longer-term base. Next key resistance now comes in up into the 1.4000 area. Setbacks should be very well supported down into the 1.3000 area.USDCAD – fundamental overview
Most of the weakness in the Canadian Dollar we've seen in recent sessions has come from ongoing downside pressure on the price of oil. Key standouts on Monday’s calendar come from Eurozone money supply, UK CBI trades, an ECB Lagarde speech, Dallas Fed manufacturing, and a Fed Williams speech.NZDUSD – technical overview
Overall pressure remains on the downside with risk for the current recovery rally to stall out and form a lower top for the next major downside extension. A break back above 0.6469 would be required to take the immediate pressure off the downside.NZDUSD – fundamental overview
The New Zealand Dollar has come under some mild pressure into the new week, mostly on the back of a downturn in sentiment and broad demand for the US Dollar. Key standouts on Monday’s calendar come from Eurozone money supply, UK CBI trades, an ECB Lagarde speech, Dallas Fed manufacturing, and a Fed Williams speech.US SPX 500 – technical overview
Longer-term technical studies are in the process of unwinding from extended readings off record highs. Look for rallies to be well capped in favor of lower tops and lower lows. A monthly close back above 4000 will be required at a minimum to take the immediate pressure off the downside. Next major support comes in around 3200.US SPX 500 – fundamental overview
We've finally reached a point in the cycle where the Fed recognizes unanchored inflation expectations pose a greater downside risk than over-tightening. This is significant, as it means less investor friendly monetary policy that risks potential recession in the months ahead. Overall, we expect inflation to continue to be a problem in Q4 2022 and Q1 2023 that results in downside pressure into rallies.GOLD (SPOT) – technical overview
The 2019 breakout above the 2016 high at 1375 was a significant development, opening the door for fresh record highs. Setbacks should now be well supported above 1600 on a monthly close basis ahead of the next major upside extension. Back above 1808 will strengthen the bullish outlook.GOLD (SPOT) – fundamental overview
The yellow metal continues to be well supported on dips with solid demand from medium and longer-term accounts. These players are more concerned about inflation risk and a less upbeat global growth outlook. All of this should keep the commodity well supported, with many market participants also fleeing to the hard asset as the grand dichotomy of record high equities and record low yields comes to an unnerving climax.