


Next 24 hours: Buck cools off into North American session
Today’s report: Sentiment sours as global data disappoints
Softer PMI reads out of China and the Eurozone added to current downside pressure on risk assets, with the US Dollar extending its run and equities under pressure as a consequence. Meanwhile, bond yields surged after Saudi Arabia and Russia extended oil production cuts.
Wake-up call
- PMIs revised
- composite PMIs
- household spending
- peak inflation
- policy decision
- commodity prices
- Messy combination
- Dealers report
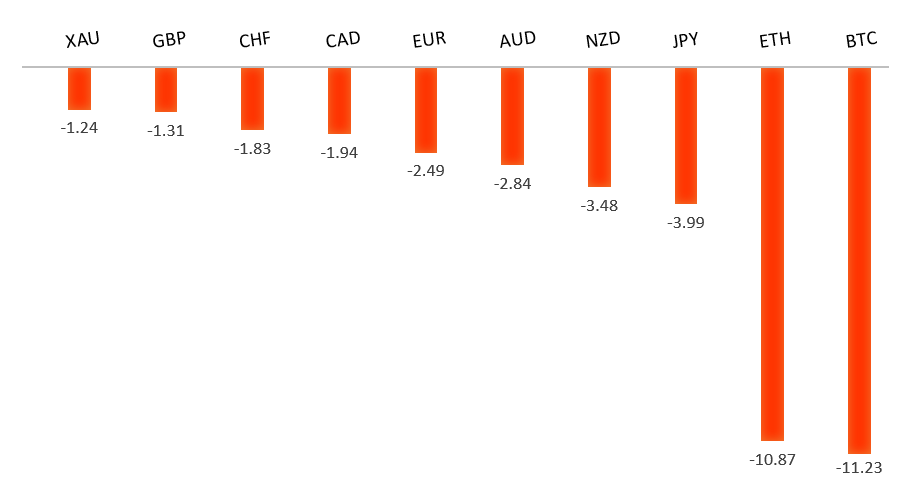
Peformance chart: 30 Day Performance vs. US dollar (%)
Suggested reading
- Why ‘Finfluencers’ Will Always Find Addicts, A. Mukherjee, Bloomberg (September 5, 2023)
- Why UK Labour Rejects a Wealth Tax, R. Shrimsley, FT (September 5, 2023)
Chart talk: Technical & fundamental highlights
Choose pair:
EURUSD – technical overview
The Euro remains well supported on dips following a run to the topside through 1.1000. Any additional setbacks should be well supported ahead of 1.0500 in favor of a bullish continuation. Ultimately, only a monthly close back below 1.0500 would give reason for concern. Next key resistance comes in the form of the 2023 high at 1.1276.EURUSD – fundamental overview
Euro area August PMIs were revised lower across the board, while Eurozone producer prices also slid from the previous print. Meanwhile, European bank stocks were looking vulnerable and all of this contributed to additional declines in the single currency. Key standouts on Wednesday’s calendar come from German factory orders, German, Eurozone, and UK construction PMIs, Eurozone retail sales, Canada trade, US trade, US services PMI reads, the Bank of Canada policy decision, and the Fed Beige Book late in the day.EURUSD - Technical charts in detail
GBPUSD – technical overview
Signs have emerged of the market wanting to put in a longer-term base after collapsing to a record low in September 2022. The November 2022 monthly close back above 1.2000 strengthens this prospect. Any setbacks should now be well supported ahead of 1.2500. Next key resistance comes in at 1.3143.GBPUSD – fundamental overview
The Pound was a victim of more broad based US Dollar demand but did manage to find some support from better than expected UK PMI reads. Key standouts on Wednesday’s calendar come from German factory orders, German, Eurozone, and UK construction PMIs, Eurozone retail sales, Canada trade, US trade, US services PMI reads, the Bank of Canada policy decision, and the Fed Beige Book late in the day.USDJPY – technical overview
At this stage, it looks like the market is wanting to resume the bigger picture uptrend and head back towards a retest of that multi-year high from October 2022 up at 151.95. Look for any weakness to continue to be well supported on dips.USDJPY – fundamental overview
The wider US-Japan rate differential continues to be driving force behind Yen weakness. At the same time, Japan household spending has come in at the lowest level since February 2021. Key standouts on Wednesday’s calendar come from German factory orders, German, Eurozone, and UK construction PMIs, Eurozone retail sales, Canada trade, US trade, US services PMI reads, the Bank of Canada policy decision, and the Fed Beige Book late in the day.AUDUSD – technical overview
There are signs of the potential formation of a longer-term base with the market trading down into a meaningful longer-term support zone. Only a monthly close below 0.6400 would give reason for rethink. Back above 0.6523 will take the immediate pressure off the downside and strengthen case for a bottom.AUDUSD – fundamental overview
The Australian Dollar sunk to a fresh yearly low after the RBA left rates on hold and said inflation had peaked. Key standouts on Wednesday’s calendar come from German factory orders, German, Eurozone, and UK construction PMIs, Eurozone retail sales, Canada trade, US trade, US services PMI reads, the Bank of Canada policy decision, and the Fed Beige Book late in the day.USDCAD – technical overview
Above 1.3000 signals an end to a period of longer-term bearish consolidation and suggests the market is in the process of carving out a more significant longer-term base. Next key resistance now comes in up into the 1.4000 area. Setbacks should be very well supported down into the 1.3000 area.USDCAD – fundamental overview
The Canadian Dollar has been hammered since last Friday after Canada GDP missed badly, dropping into negative territory, while Canada PMIs also sunk to a new low. The local rate market now sees no chance for a rate hike from the Bank of Canada later today. We have however seen setbacks mitigated on oil's surge to a fresh 2023 high. Key standouts on Wednesday’s calendar come from German factory orders, German, Eurozone, and UK construction PMIs, Eurozone retail sales, Canada trade, US trade, US services PMI reads, the Bank of Canada policy decision, and the Fed Beige Book late in the day.NZDUSD – technical overview
Overall pressure remains on the downside with the market once again stalling out on a run up into the 0.6500 area. Ultimately, a break back above 0.6015 would be required to take the immediate pressure off the downside. A monthly close below 0.6000 would intensify bearish price action.NZDUSD – fundamental overview
The New Zealand Dollar is back under pressure in recent sessions as risk off flow and soft local data weighs on the correlated commodity currency. ANZ commodity prices fell for a third month in August. Key standouts on Wednesday’s calendar come from German factory orders, German, Eurozone, and UK construction PMIs, Eurozone retail sales, Canada trade, US trade, US services PMI reads, the Bank of Canada policy decision, and the Fed Beige Book late in the day.US SPX 500 – technical overview
Longer-term technical studies are in the process of unwinding from extended readings off record highs. Look for rallies to be well capped in favor of lower tops and lower lows. A monthly close back above 4600 will be required to take the immediate pressure off the downside. Next key support comes in at 4328.US SPX 500 – fundamental overview
We've finally reached a point in the cycle where the Fed recognizes unanchored inflation expectations pose a greater downside risk than over-tightening. This is significant, as it means less investor friendly monetary policy, even in the face of a less certain growth outlook. Overall, we expect inflation to continue to be a problem in 2023 that results in downside pressure into rallies despite market expectations that would argue otherwise.GOLD (SPOT) – technical overview
The 2019 breakout above the 2016 high at 1375 was a significant development, opening the door for fresh record highs. Setbacks should now be well supported above 1600 on a monthly close basis ahead of the next major upside extension. Next major resistance comes in at 2100, above which opens the next extension towards 2500.GOLD (SPOT) – fundamental overview
The yellow metal continues to be well supported on dips with solid demand from medium and longer-term accounts. These players are more concerned about inflation risk and a less upbeat global growth outlook. All of this should keep the commodity well supported, with many market participants also fleeing to the hard asset as the grand dichotomy of record high equities and record low yields comes to an unnerving climax.