


Next 24 hours: Traders caught off guard by BOJ Ueda
Today’s report: When bad news is bad news
The trend of bad news being good news can sometimes be too much. For the most part, investors like a good dose of bad news as it’s likely to translate to more investor friendly monetary policy. But sometimes, bad news is just bad news.
Wake-up call
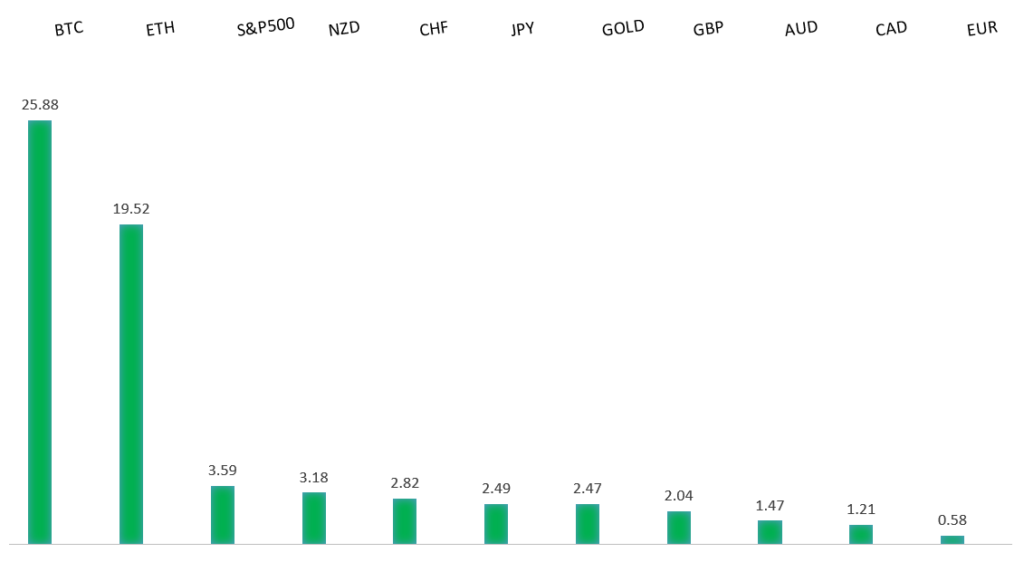
Peformance chart: 30 Day Performance vs. US dollar (%)
Suggested reading
- The Santa Claus Rally Came Early. What's Your Next Move?, Morningstar (December 2, 2023)
- How Biden's Inflation Reduction Act Changed the World, Financial Times (December 6, 2023)
Chart talk: Technical & fundamental highlights
Choose pair:
EURUSD – technical overview
The Euro has been in a multi-month consolidation since bottoming out in 2022. Setbacks have since been exceptionally well supported on dips below 1.0500, with a higher platform sought out ahead of the next major upside extension. Look for a push through the yearly high at 1.1276 to strengthen the constructive outlook and extend the recovery run towards 1.2000. Only back below 1.0400 negates.EURUSD – fundamental overview
The Euro continues to slide on rate pricing and weak economic data. The OIS market sees the ECB cutting rates as early as March 2024, while pricing five rate cuts by the October 2024 meeting. Earlier this week, ECB Schnabel, a widely known hawk, said further rate hikes were unlikely, as she saw inflation slowing faster than expected, spurring the latest bout of rate cut speculation. On the data front, German manufacturing and construction was a major disappointment. Key standouts on Thursday’s calendar come from German industrial production, Eurozone GDP, and US initial jobless claims.EURUSD - Technical charts in detail
GBPUSD – technical overview
Signs have emerged of the market wanting to put in a longer-term base after collapsing to a record low in September 2022. The November 2022 monthly close back above 1.2000 strengthens this prospect. Any setbacks should now be well supported ahead of 1.2000. Next key resistance comes in at 1.2818.GBPUSD – fundamental overview
The OIS market is currently fully pricing three 25 basis point BOE rate cuts by the end of 2024, reflecting similar expectations for rate cuts by central banks in other major developed market economies. All of this has happened despite the BOE communications offering up no such guidance. On the data front, UK construction PMIs saw a downtick. Key standouts on Thursday’s calendar come from German industrial production, Eurozone GDP, and US initial jobless claims.USDJPY – technical overview
The market remains confined to a strong uptrend, with sights set on a retest and break of the multi-year high from 2022 at 151.95. A push through this level will open the next major upside extension towards 155.00. Key support comes in at 145.00, with only a weekly close below to delay the constructive outlook.USDJPY – fundamental overview
We haven's seen much movement in the Yen in recent sessions, with the currency content to trade sideways in the lead up to the BOJ policy decision later this month. Overall however, BOJ speak has continued to voice support for ultra-loose monetary policy. We've heard the usual bits relating to the removal of the NIRP and YCC should economic data show progress towards stable and sustainable inflation and wage gains. But this is more bark than bite. Key standouts on Thursday’s calendar come from German industrial production, Eurozone GDP, and US initial jobless claims.AUDUSD – technical overview
There are signs of the potential formation of a longer-term base with the market trading down into a meaningful longer-term support zone. Only a monthly close below 0.6200 would give reason for rethink. Back above 0.6900 will take the big picture pressure off the downside and strengthen case for a bottom.AUDUSD – fundamental overview
The Australian Dollar has taken a hit in recent sessions on the back of the Wednesday Aussie GDP miss. Lower US equities and broad US Dollar demand have added to the downside pressure. Key standouts on Thursday’s calendar come from German industrial production, Eurozone GDP, and US initial jobless claims.USDCAD – technical overview
Above 1.3000 signals an end to a period of longer-term bearish consolidation and suggests the market is in the process of carving out a more significant longer-term base. Next key resistance now comes in up into the 1.4000 area. Setbacks should be very well supported down into the 1.3000 area.USDCAD – fundamental overview
The Bank of Canada kept its policy rate unchanged at 5.0% as had been widely expected, with the focus on the tone of the central bank's statement and forward guidance. The Bank of Canada emphasized the economy was no longer seeing excess demand, with current monetary policy settings seen as being sufficient to curb spending amidst loosening labor market conditions. The usual comments on standby to raise rates if necessary were left in as well. Key standouts on Thursday’s calendar come from German industrial production, Eurozone GDP, and US initial jobless claims.NZDUSD – technical overview
Overall pressure remains on the downside with the market continuing to stall out on runs up into the 0.6500 area. At the same time, there are some signs of the market wanting to put in a longer-term base. Ultimately, a break back above 0.6500 would be required to take the medium-term pressure off the downside and encourage this prospect. A monthly close below 0.5800 will intensify bearish price action.NZDUSD – fundamental overview
The OIS market is now fully pricing a 25 basis point rate cut by the August 2024 RBNZ meeting. Kiwi has come under pressure in recent sessions from downside pressure on risk assets and renewed US Dollar demand. Key standouts on Thursday’s calendar come from German industrial production, Eurozone GDP, and US initial jobless claims.US SPX 500 – technical overview
Longer-term technical studies are in the process of unwinding from extended readings off record highs. Look for rallies to be well capped in favor of lower tops and lower lows. A monthly close back above 4600 will be required to take the immediate pressure off the downside. Next key support comes in at 4308.US SPX 500 – fundamental overview
Investors continue to struggle with the reality of a higher for longer Fed policy track in the face of ongoing worry around inflation, while also contending with geopolitical risk in 2023. Overall, we expect inflation to continue to be a problem in 2023 that results in downside pressure into rallies despite recent data and market expectations that would argue otherwise.GOLD (SPOT) – technical overview
The 2019 breakout above the 2016 high at 1375 was a significant development, opening the door for fresh record highs. Setbacks should now be well supported above 1900 on a monthly close basis ahead of the next major upside extension towards 2500.GOLD (SPOT) – fundamental overview
The yellow metal continues to be well supported on dips with solid demand from medium and longer-term accounts. These players are more concerned about inflation risk and a less stable and upbeat global growth outlook. All of this should keep the commodity well supported, with many market participants also fleeing to the hard asset as the grand dichotomy of record high equities and record low yields comes to an unnerving climax.