


Today’s report: Waiting on the US jobs report
On Thursday, the ECB came out and cut rates as expected, while delivering a more hawkish communication all things considered, which also didn’t do anything to surprise the market. At the moment, the market feels like it wants to wait for more clarity from the US jobs report later today.
Wake-up call
- EURUSD No surprises from ECB decision
- construction PMIs
- USDJPY FinMin Suzuki back on the wires
- sentiment boost
- employment reports
- manufacturing sales
- Fed outlook
- Macro themes
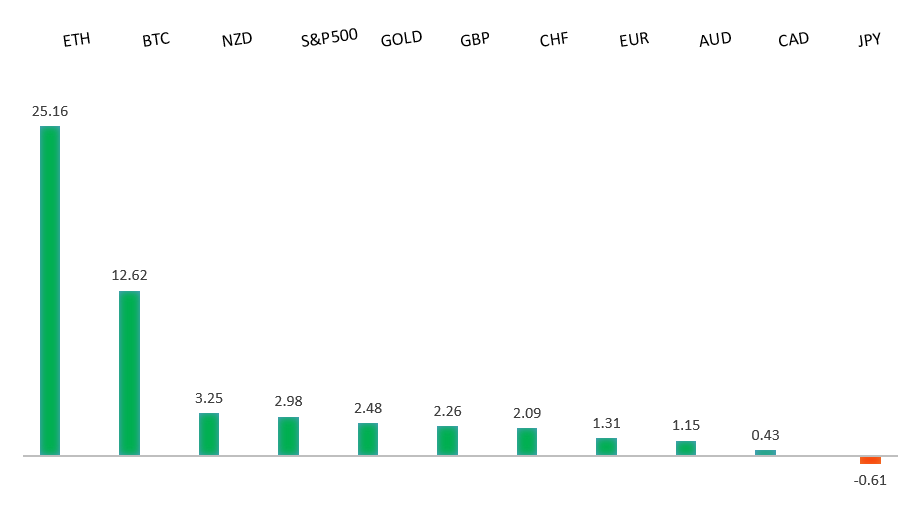
Peformance chart: 30-Day Performance vs. US dollar (%)
Suggested reading
- The 10-Year Treasury Yield is Too High, J. Paulsen, Paulsen Perspectives (June 5, 2024)
- Understanding the Psychology of Money, J. Troutner, Equius Partners (May, 2024)
Chart talk: Technical & fundamental highlights
Choose pair:
EURUSD – technical overview
The Euro has been in a multi-month consolidation since bottoming out in 2022. Setbacks have since been exceptionally well supported on dips below 1.0500, with a higher platform sought out ahead of the next major upside extension. Look for a push through the 2023 high at 1.1276 to strengthen the constructive outlook and extend the recovery run towards 1.2000. Only back below 1.0400 negates.EURUSD – fundamental overview
There were no major surprises from Thursday's ECB decision with the central bank cutting rates by 25 basis points, while still delivering a somewhat hawkish message. The Euro has been well supported in the aftermath. Key standouts on Friday’s calendar come from German trade, German industrial production, Eurozone GDP, Eurozone employment, Canada employment, and the monthly employment report out of the US.EURUSD - Technical charts in detail
GBPUSD – technical overview
Signs have emerged of the market wanting to put in a longer-term base after collapsing to a record low in September 2022. The latest push to a fresh 2024 high beyond 1.2830 confirms the outlook and opens the door for the next major upside extension towards the 2023 high at 1.3143. Any setbacks should now be well supported ahead of 1.2000.GBPUSD – fundamental overview
The Pound continues to hold up well, getting its latest boost from Thursday's welcome jump in UK construction PMIs. Key standouts on Friday’s calendar come from German trade, German industrial production, Eurozone GDP, Eurozone employment, Canada employment, and the monthly employment report out of the US.USDJPY – technical overview
The market remains confined to a strong uptrend, most recently extending to a multi-year high through 160.00. Key support comes in at 151.95, with only a weekly close below to delay the constructive outlook.USDJPY – fundamental overview
Comments from Japanese FinMin Suzuki haven't done much to impact price action but have perhaps slowed the pace of Yen selling on Friday. Suzuki said authorities would take measures to counter excessive FX moves, and that there was a need to maintain market faith in Japan's fiscal policy amid the shift to interest rates in positive territory. Finally, he added intervention should be done in a restrained manner taking into account necessity and effectiveness. Key standouts on Friday’s calendar come from German trade, German industrial production, Eurozone GDP, Eurozone employment, Canada employment, and the monthly employment report out of the US.AUDUSD – technical overview
There are signs of the potential formation of a longer-term base with the market trading down into a meaningful longer-term support zone. Only a monthly close below 0.6200 would give reason for rethink. Back above 0.6900 will take the big picture pressure off the downside and strengthen case for a bottom.AUDUSD – fundamental overview
The Australian Dollar has been supported this week on an Aussie surplus and another record run in US equities. Key standouts on Friday’s calendar come from German trade, German industrial production, Eurozone GDP, Eurozone employment, Canada employment, and the monthly employment report out of the US.USDCAD – technical overview
Above 1.3000 signals an end to a period of longer-term bearish consolidation and suggests the market is in the process of carving out a more significant longer-term base. Next key resistance now comes in up into the 1.4000 area. Setbacks should be very well supported down into the 1.3000 area.USDCAD – fundamental overview
A suffering Canadian Dollar got a little relief on Thursday on the back of higher commodities and energies prices. Key standouts on Friday’s calendar come from German trade, German industrial production, Eurozone GDP, Eurozone employment, Canada employment, and the monthly employment report out of the US.NZDUSD – technical overview
Overall pressure remains on the downside with the market continuing to stall out on runs up into the 0.6500 area. At the same time, there are some signs of the market wanting to put in a longer-term base. Ultimately, a break back above 0.6500 would be required to take the medium-term pressure off the downside and encourage this prospect. A monthly close below 0.5800 will intensify bearish price action.NZDUSD – fundamental overview
ANZ has come out moving up their call for an RBNZ rate cut to February 2025 from March 2025. Meanwhile, on the data front, Kiwi manufacturing sales came in much weaker than expected. Key standouts on Friday’s calendar come from German trade, German industrial production, Eurozone GDP, Eurozone employment, Canada employment, and the monthly employment report out of the US.US SPX 500 – technical overview
Longer-term technical studies continue to look quite extended, begging for a deeper correction ahead. At the same time, the latest bullish breakout to a fresh record high beyond the 2024 high opens the door for the next measured move upside extension targeting the 5650 area. Key support comes in at 5194.US SPX 500 – fundamental overview
Though we have seen a healthy adjustment of investor expectations towards the amount of rate cuts in 2024, the market still hopes policy will end up erring more towards the investor friendly, accommodative side of things. This bet has kept stocks well bid into dips and consistently pushing record highs. Still, if there is a sense the Fed will need to be more sensitive towards erring on the side of higher rates, it could invite major disruption to the stock market.GOLD (SPOT) – technical overview
The 2019 breakout above the 2016 high at 1375 was a significant development, opening the door for fresh record highs and this next major upside extension into the 2500-3000 area. Setbacks should now be well supported above 2000 on a monthly close basis.GOLD (SPOT) – fundamental overview
The yellow metal has pushed record highs in 2024 with solid demand from medium and longer-term accounts. These players are more concerned about inflation, geopolitical risk and a less upbeat global growth outlook. All of this should keep the commodity well supported, with many market participants also fleeing to the hard asset as the grand dichotomy of record high equities and record low yields comes to an end.