


Next 24 hours: Traders reconsidering BOJ outcome
Today’s report: Getting ready for central bank risk later in week
We’re coming out of a relatively quiet Monday session of trade. Overall, we’re seeing some attempts at a recovery in risk assets, though it’s been a tough and slow go thus far. The US Dollar has been in the driver’s seat as global sentiment remains subdued.
Wake-up call
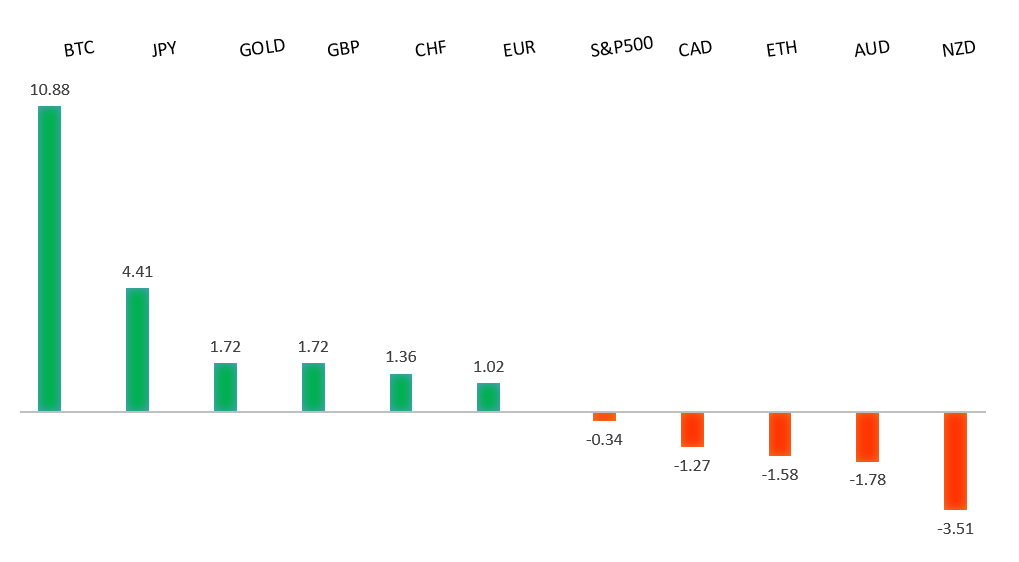
Peformance chart: 30-Day Performance vs. US dollar (%)
Suggested reading
- How An AI "Bot War" Destroyed the Online Job Market, J. Tauke, Salon (July 28, 2024)
- Tech Dip Reminds That Volatility Cuts Both Ways, Fisher Investments (July 26, 2024)
Chart talk: Technical & fundamental highlights
Choose pair:
EURUSD – technical overview
The Euro has been in a multi-month consolidation since bottoming out in 2022. Setbacks have since been exceptionally well supported on dips below 1.0500, with a higher platform sought out ahead of the next major upside extension. Look for a push through the 2023 high at 1.1276 to strengthen the constructive outlook and extend the recovery run towards 1.2000. Only back below 1.0400 negates.EURUSD – fundamental overview
The Euro has been worrying about the potential for more softness in what has already been a soft run of data in recent days. Key standouts on Tuesday’s calendar come from Japan unemployment, Aussie building permits, German GDP, German inflation reads, Eurozone GDP, Eurozone confidence and sentiment reads, US Case Shiller, house prices, JOLTs job openings, and consumer confidence.EURUSD - Technical charts in detail
GBPUSD – technical overview
Signs have emerged of the market wanting to put in a longer-term base after collapsing to a record low in September 2022. The door is now open for the next major upside extension towards the 2023 high at 1.3143. Any setbacks should be well supported ahead of 1.2500.GBPUSD – fundamental overview
UK CBI sales numbers weren't pretty, the new government is looking to raise taxes, and the market has been thinking a lot more about a BOE rate cut later this week. Key standouts on Tuesday’s calendar come from Japan unemployment, Aussie building permits, German GDP, German inflation reads, Eurozone GDP, Eurozone confidence and sentiment reads, US Case Shiller, house prices, JOLTs job openings, and consumer confidence.USDJPY – technical overview
The market remains confined to a strong uptrend, most recently extending to a multi-year high through 160.00. Key support comes in at 151.86, with only a weekly close below to delay the constructive outlook. Next major resistance comes in at 165.00.USDJPY – fundamental overview
There are still many Yen shorts caught in trapped carry trades, though we have seen some signs of renewed Yen weakness after a very healthy recovery rally. Attention turns to this week's BOJ decision which is pricing a little more than a 50% chance for a rate hike. This pricing has come down but could still be aggressive when considering the BOJ's track record. Key standouts on Tuesday’s calendar come from Japan unemployment, Aussie building permits, German GDP, German inflation reads, Eurozone GDP, Eurozone confidence and sentiment reads, US Case Shiller, house prices, JOLTs job openings, and consumer confidence.AUDUSD – technical overview
There are signs of the potential formation of a longer-term base with the market trading down into a meaningful longer-term support zone. Only a monthly close below 0.6200 would give reason for rethink. Back above 0.6900 will take the big picture pressure off the downside and strengthen case for a bottom.AUDUSD – fundamental overview
The commodities sector remains under pressure and Chinese equities have struggled. However, the Australian Dollar was able to snap a 9 day losing streak against the Buck this past Friday, getting help from a recovery in US equities. Key standouts on Tuesday’s calendar come from Japan unemployment, Aussie building permits, German GDP, German inflation reads, Eurozone GDP, Eurozone confidence and sentiment reads, US Case Shiller, house prices, JOLTs job openings, and consumer confidence.USDCAD – technical overview
Above 1.3000 signals an end to a period of longer-term bearish consolidation and suggests the market is in the process of carving out a more significant longer-term base. Next key resistance now comes in up into the 1.4000 area. Setbacks should be very well supported down into the 1.3000 area.USDCAD – fundamental overview
The Canadian Dollar slid to a fresh yearly low against the Buck on Monday, still struggling with faltering US equities, a dovish Bank of Canada, weaker local data, and softer commodities prices. Key standouts on Tuesday’s calendar come from Japan unemployment, Aussie building permits, German GDP, German inflation reads, Eurozone GDP, Eurozone confidence and sentiment reads, US Case Shiller, house prices, JOLTs job openings, and consumer confidence.NZDUSD – technical overview
Overall pressure remains on the downside with the market continuing to stall out on runs up into the 0.6500 area. At the same time, there are some signs of the market wanting to put in a longer-term base. Ultimately, a break back above 0.6500 would be required to take the medium-term pressure off the downside and encourage this prospect. A monthly close below 0.5800 will intensify bearish price action.NZDUSD – fundamental overview
A soft run of Kiwi data along with an ongoing slide in commodities prices and disruption in US equities has proven to be a big weight on the New Zealand Dollar. Key standouts on Tuesday’s calendar come from Japan unemployment, Aussie building permits, German GDP, German inflation reads, Eurozone GDP, Eurozone confidence and sentiment reads, US Case Shiller, house prices, JOLTs job openings, and consumer confidence.US SPX 500 – technical overview
Longer-term technical studies are in the process of unwinding from overbought levels. There is now room for a pullback towards previous resistance turned support in the form of the previous record high from April around 5,290 before the market considers a run to another record high.US SPX 500 – fundamental overview
Though we have seen a healthy adjustment of investor expectations towards the amount of rate cuts in 2024, the market still hopes policy will end up erring more towards the investor friendly, accommodative side of things. This bet has kept stocks well bid into dips and consistently pushing record highs. Still, if there is a sense the Fed will need to be more sensitive towards erring on the side of higher rates, it could invite a much bigger disruption to stocks.GOLD (SPOT) – technical overview
The 2019 breakout above the 2016 high at 1375 was a significant development, opening the door for fresh record highs and this next major upside extension into the 2500-3000 area. Setbacks should now be well supported above 2200 on a monthly close basis.GOLD (SPOT) – fundamental overview
The yellow metal has pushed record highs in 2024 with solid demand from medium and longer-term accounts. These players are more concerned about inflation, geopolitical risk and a less upbeat global growth outlook. All of this should keep the commodity well supported, with many market participants also fleeing to the hard asset as the grand dichotomy of record high equities and record low yields comes to an end.