


 | ||
| 30th May 2025 | view in browser | ||
| Dollar dips as tariff ruling sparks uncertainty | ||
| The US dollar initially rose after the US Court of International Trade struck down Trump’s tariffs but later weakened as markets considered ongoing uncertainties and signs of a slowing US economy from recent data. | ||
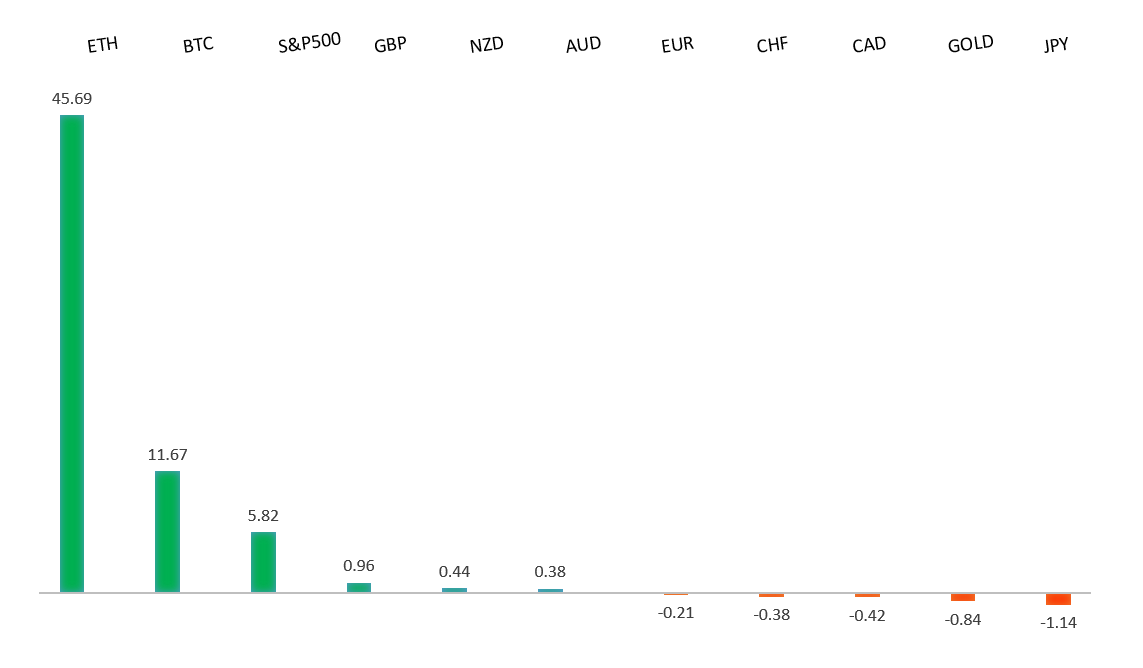
| Performance chart 30day v. USD (%) | ||
 | ||
| Technical & fundamental highlights | ||
| EURUSD: technical overview | ||
| The Euro has finally broken out from a multi-month consolidation off a critical longer-term low. This latest push through the 2023 high lends further support to the case for a meaningful bottom, setting the stage for a bullish structural shift and the next major upside extension targeting the 2021 high at 1.2350. Setbacks should be exceptionally well supported below 1.1000. | ||
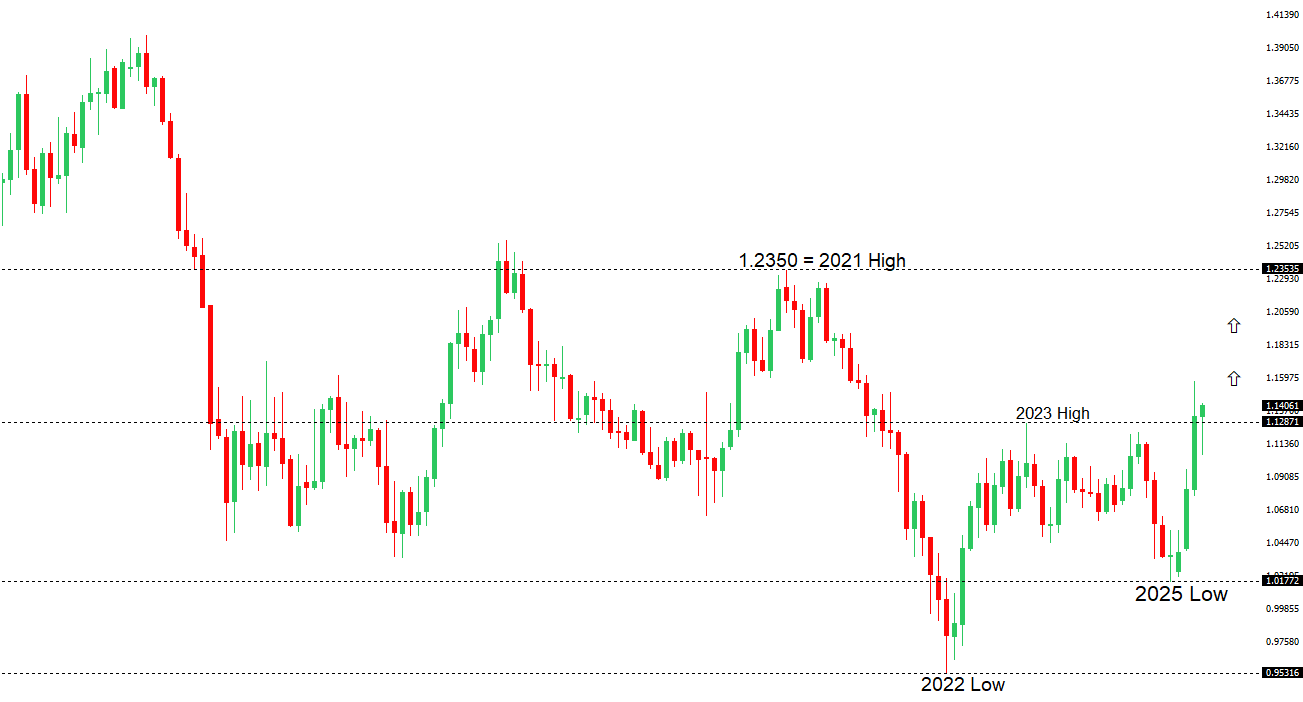 | ||
| R2 1.1474 - 11 April high - Medium R1 1.1419 - 26 May high - Medium S1 1.1131 - 16 May low - Medium S2 1.1065 - 12 May low - Medium | ||
| EURUSD: fundamental overview | ||
| The EU-US trade talks will proceed despite a court ruling against Trump’s tariffs, which does not affect existing tariffs on steel, aluminum, autos, or potential future tariffs on pharmaceuticals—key European exports likely to be central in negotiations. The EU may reconsider a mutual elimination of industrial tariffs, previously rejected by the US, and adopt a firmer stance in talks due to reduced pressure for quick concessions. Inflation in the eurozone’s major economies (Germany, Spain, Italy, and France, representing over 70% of the region’s output) is at or below the ECB’s 2% target for the first time in eight months, driven by a strong euro, falling energy costs, and easing wage pressures. This low inflation, alongside external risks like US tariffs, supports expectations for an ECB interest rate cut on June 5 to stimulate growth. | ||
| USDJPY: technical overview | ||
| There are signs of a meaningful top in place after the market put in a multi-year high in 2024. At this point, the door is now open for a deeper setback below the 2024 low at 139.58 over the coming sessions exposing a retest of the 2023 low. Rallies should be well capped below 150.00. | ||
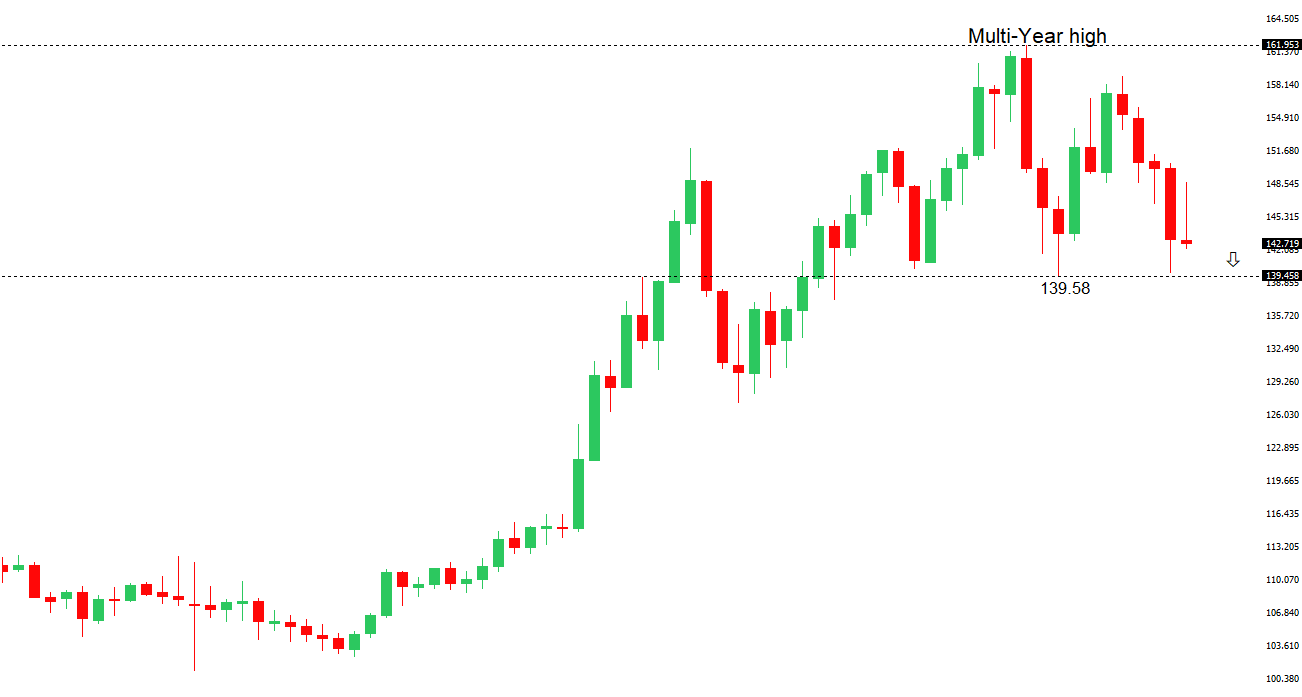 | ||
| R2 148.65 - 12 May high - Medium R1 146.29 - 29 May high - Medium S1 142.11 - 27 May low - Medium S2 141.97 - 29 April low - Medium | ||
| USDJPY: fundamental overview | ||
| The US dollar weakened after initial strength following a court ruling on Trump’s tariffs, as markets anticipate increased uncertainty, boosting the safe-haven Japanese yen, supported by data favoring Bank of Japan rate hikes. Japan’s PM Ishiba, after inconclusive talks with Trump, emphasized fair trade and strengthening the CPTPP, aiming to deepen economic ties with Southeast Asia and Europe while maintaining US security ties. Japan’s economic data shows stable unemployment at 2.5%, elevated Tokyo CPI at 3.6% (indicating persistent inflation), and resilient retail sales growth at 3.3% year-on-year, supporting BOJ’s case for potential rate hikes despite a slight industrial output decline. | ||
| AUDUSD: technical overview | ||
| There are signs of the potential formation of a longer-term base with the market trading down into a meaningful longer-term support zone. Only a monthly close below 0.5500 would give reason for rethink. A monthly close back above 0.7000 will take the big picture pressure off the downside and strengthen case for a bottom. | ||
 | ||
| R2 0.6550 - 25 November 2024 high - Strong R1 0.6538 - 26 May/2025 high - Medium S1 0.6344 - 24 April low - Medium S1 0.6275 - 14 April low - Strong | ||
| AUDUSD: fundamental overview | ||
| The Australian Dollar is tracking the Chinese yuan’s movements this week. RBA Governor Michele Bullock’s shift away from a strict inflation focus toward broader economic risks has led markets to expect three additional rate cuts in 2025, potentially lowering the cash rate to 3.10% by November. Australian retail sales unexpectedly fell by 0.1% in April, driven by reduced spending on clothing and department stores, while private sector credit grew strongly at 0.7% month-on-month and 6.7% year-on-year, showing resilient demand. However, a sharp 5.7% drop in building approvals signals potential housing supply challenges, reinforcing the RBA’s dovish stance after weak economic indicators like a 0.1% decline in Q1 private capital expenditure. | ||
| Suggested reading | ||
| Japan’s Day Of Economic Reckoning, D. Lachman, AEIdeas (May 28, 2025) The Beautiful Budget Bill Can Deliver Decisive Deregulation, W. Crews, Forbes (May 28, 2025) | ||