


 | ||
| 27th October 2025 | view in browser | ||
| CPI cools, Fed rate cut looms | ||
| The September CPI report showed U.S. inflation cooling more than expected, with core CPI rising only 0.2% month-over-month and 3% year-over-year, reinforcing expectations for a Federal Reserve 25-basis-point rate cut at this week, lowering the target range to 3.75–4.00%. | ||
| Performance chart 30day v. USD (%) | ||
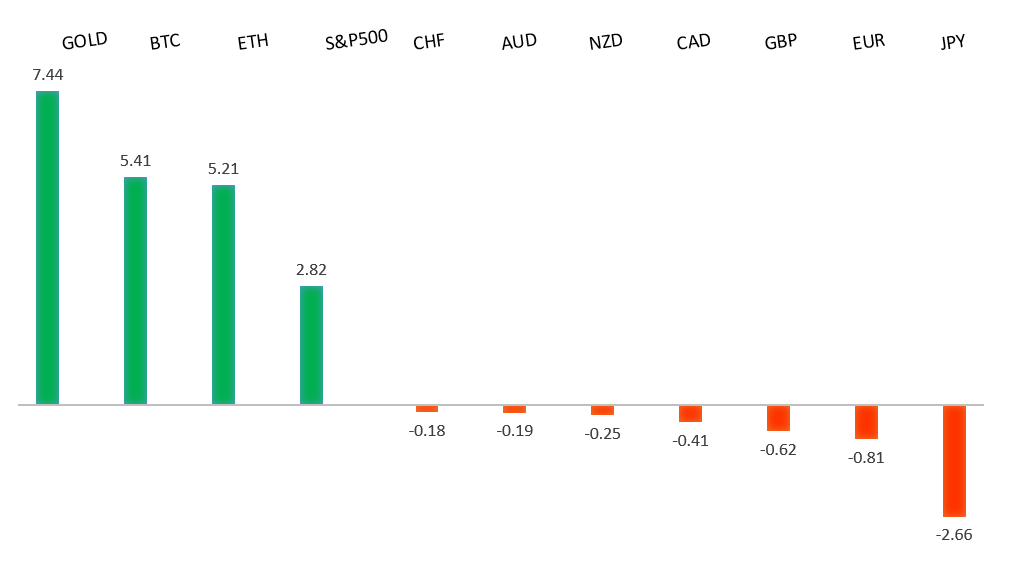 | ||
| Technical & fundamental highlights | ||
| EURUSD: technical overview | ||
| The Euro outlook remains constructive with higher lows sought out on dips in favor of the next major upside extension targeting the 2021 high at 1.2350. Setbacks should be exceptionally well supported ahead of 1.1300. | ||
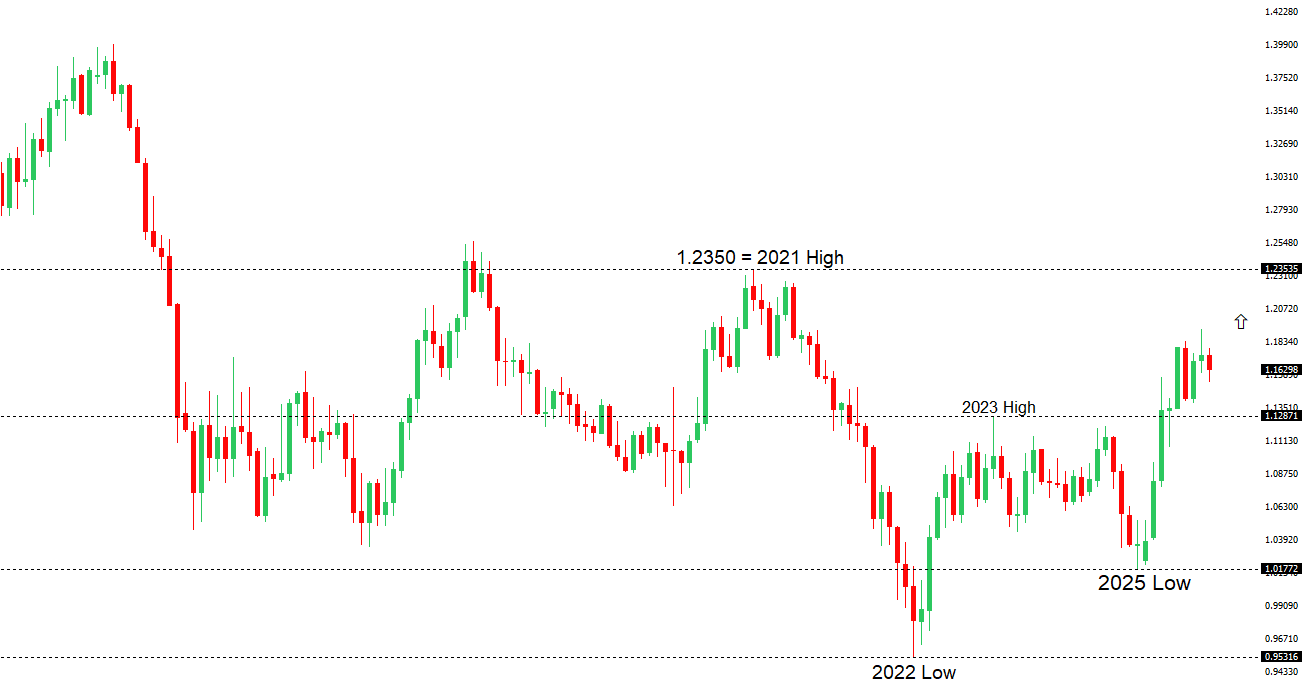 | ||
| R2 1.1779 - 1 October high -Strong R1 1.1729 - 17 October high - Medium S1 1.1542 - 9 October low - Medium S2 1.1528 - 5 August low - Strong | ||
| EURUSD: fundamental overview | ||
| The European Central Bank is expected to maintain steady interest rates at its October 30, 2025, meeting, confident in a stable economic outlook supported by Germany’s fiscal stimulus and resilient services sector, despite transient U.S. tariff effects. ECB President Lagarde will likely emphasize policy stability, noting inflation is largely under control while acknowledging risks from geopolitical and trade tensions. Recent data, including a strong Eurozone Composite PMI of 52.2, supports this stance, though manufacturing remains fragile, and business confidence is tempered by export demand concerns. Key upcoming data, such as Eurozone GDP, CPI, and Germany’s IFO Business Climate (forecasted to stabilize around 88.0–88.5), will provide further insights. | ||
| USDJPY: technical overview | ||
| There are signs of a meaningful top in place after the market put in a multi-year high in 2024. At this point, the door is now open for a deeper setback below the 2024 low at 139.58, exposing a retest of the 2023 low. Rallies should be well capped below 155.00. | ||
 | ||
| R2 154.80 - 12 February high - Strong R1 153.28 - 10 October high - Medium S1 149.38 - 17 October low - Medium S2 149.03 - 6 October low - Strong | ||
| USDJPY: fundamental overview | ||
| The recent USDJPY rally is driven more by Japanese developments than broad U.S. dollar strength, with new Prime Minister Sanae Takaichi’s expansionary fiscal policies and continued monetary stimulus fueling yen weakness. However, risks like potential fiscal discipline from Takaichi’s coalition, the Bank of Japan’s upcoming meeting signaling tighter policy, and possible Ministry of Finance intervention could limit further gains. President Trump’s visit to Japan (October 27–29) focusing on trade and defense, alongside improving U.S.-China trade relations, may temporarily bolster USDJPY, but key Japanese economic data this week, including jobless rate and CPI, could influence market dynamics. | ||
| AUDUSD: technical overview | ||
| There are signs of the potential formation of a longer-term base with the market trading down into a meaningful longer-term support zone. Only a monthly close below 0.5500 would give reason for rethink. A monthly close back above 0.7000 will take the big picture pressure off the downside and strengthen case for a bottom. | ||
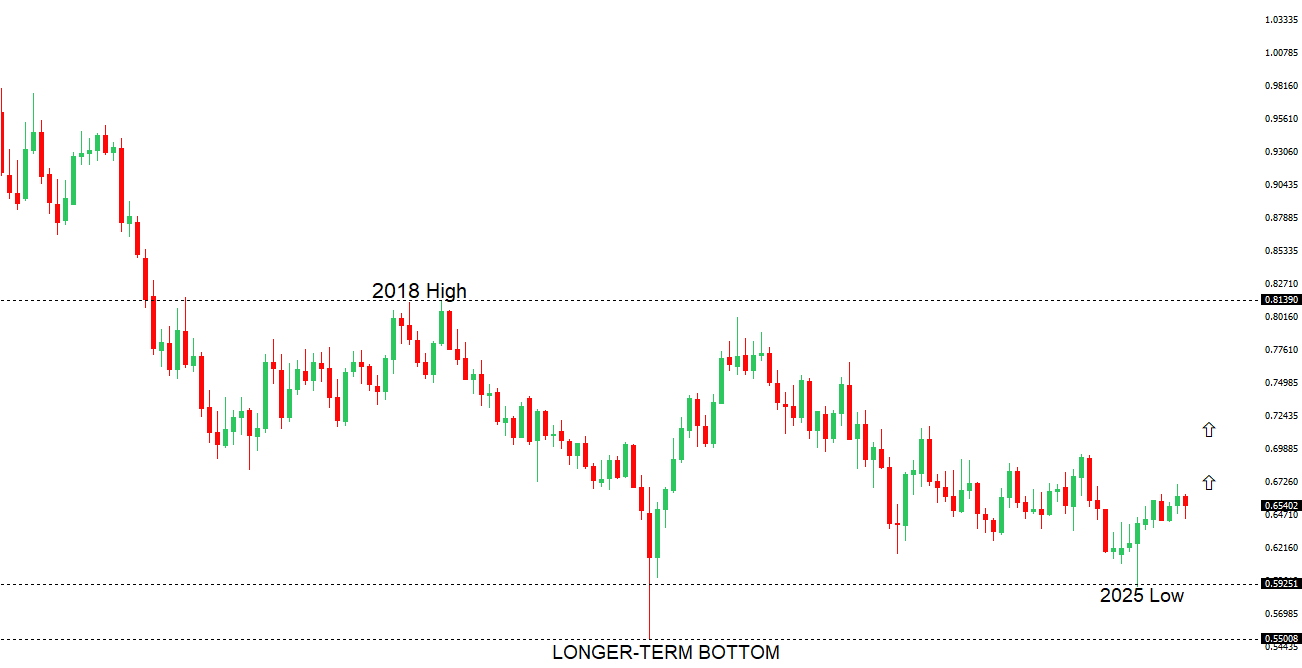 | ||
| R2 0.6629 - 1 October high - Strong R1 0.6573 - 10 October high - Medium S1 0.6471 - 16 October low - Medium S1 0.6440 - 14 October low - Strong | ||
| AUDUSD: fundamental overview | ||
| The Reserve Bank of Australia kept the cash rate at 3.60% in September, prompting debate about whether its rate-cutting cycle has paused. While some economists predict another cut in November due to declining inflation (2.1% CPI) and rising unemployment (4.5%), major banks expect the RBA to hold rates until early 2026, citing cautious optimism and mixed economic signals. Markets assign a 63% chance of a November 4 rate cut, with the upcoming third-quarter CPI data and RBA Governor Michele Bullock’s comments likely to influence expectations, alongside global factors like U.S. Federal Reserve policy and U.S.-China trade talks. | ||
| Suggested reading | ||
| The AI rollout is here – and it’s messy, I. Berwick, Financial Times (October 27, 2025) Are Investors Ignoring Red Flags in the Stock Market?, S. Hansen, Morningstar (October 24, 2025) | ||