


 | ||
| 24th December 2025 | view in browser | ||
| Fed cut expectations firm into holidays | ||
| The US Dollar is softer across the board as markets drift toward the Christmas break following yesterday’s mixed US data, which has reinforced expectations for further Fed rate cuts in 2026. | ||
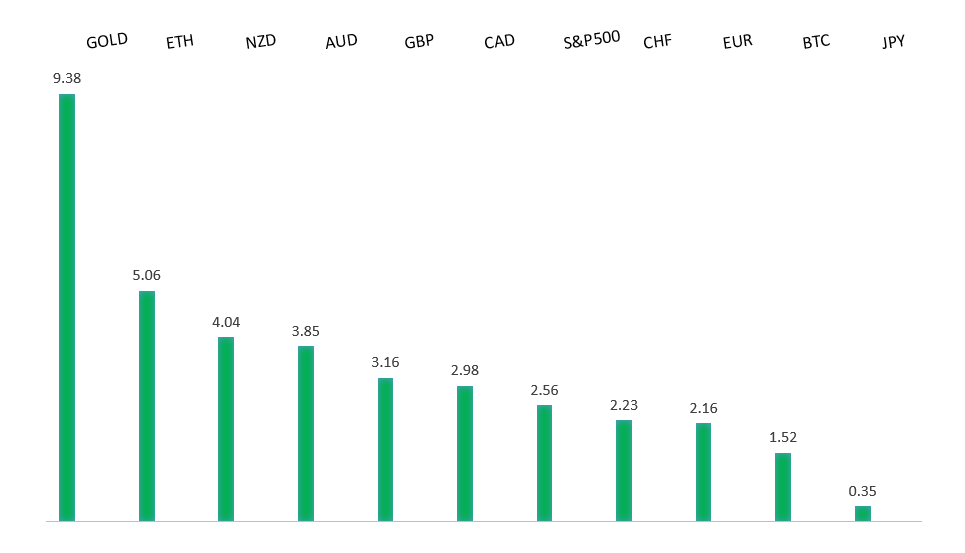
| Performance chart 30day v. USD (%) | ||
 | ||
| Technical & fundamental highlights | ||
| EURUSD: technical overview | ||
| The Euro outlook remains constructive with higher lows sought out on dips in favor of the next major upside extension targeting the 2021 high at 1.2350. Setbacks should be exceptionally well supported ahead of 1.1400. | ||
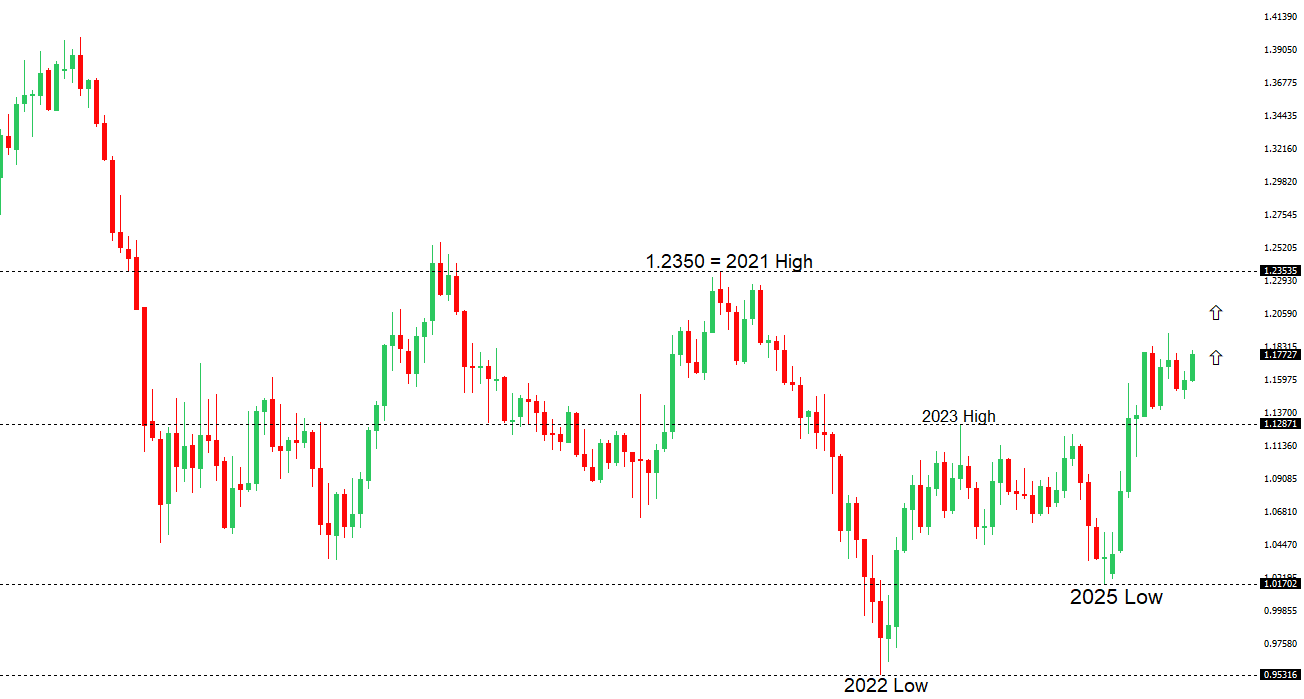 | ||
| R2 1.1919 - 17 September/2025 high -Strong R1 1.1809 - 24 December high - Medium S1 1.1703 - 19 December low - Strong S2 1.1615 - 9 December low - Strong | ||
| EURUSD: fundamental overview | ||
| The euro remains near its strongest level since late September. Support has come from the ECB keeping rates unchanged, expressing confidence in the eurozone’s resilience to US tariffs, and raising its 2025 growth forecast to 1.4%. Stronger-than-expected data, including a sharp drop in German import prices due to lower energy costs, also helped sentiment, even as German bond yields eased from recent highs. European stocks finished modestly higher, led by pharmaceutical shares after Novo Nordisk secured US approval for its oral obesity drug. | ||
| USDJPY: technical overview | ||
| There are signs of a meaningful top in place after the market put in a multi-year high in 2024. At this point, rallies should be well capped ahead of 160.00 ahead of a fresh down-leg back towards the 2024 low at 139.58. | ||
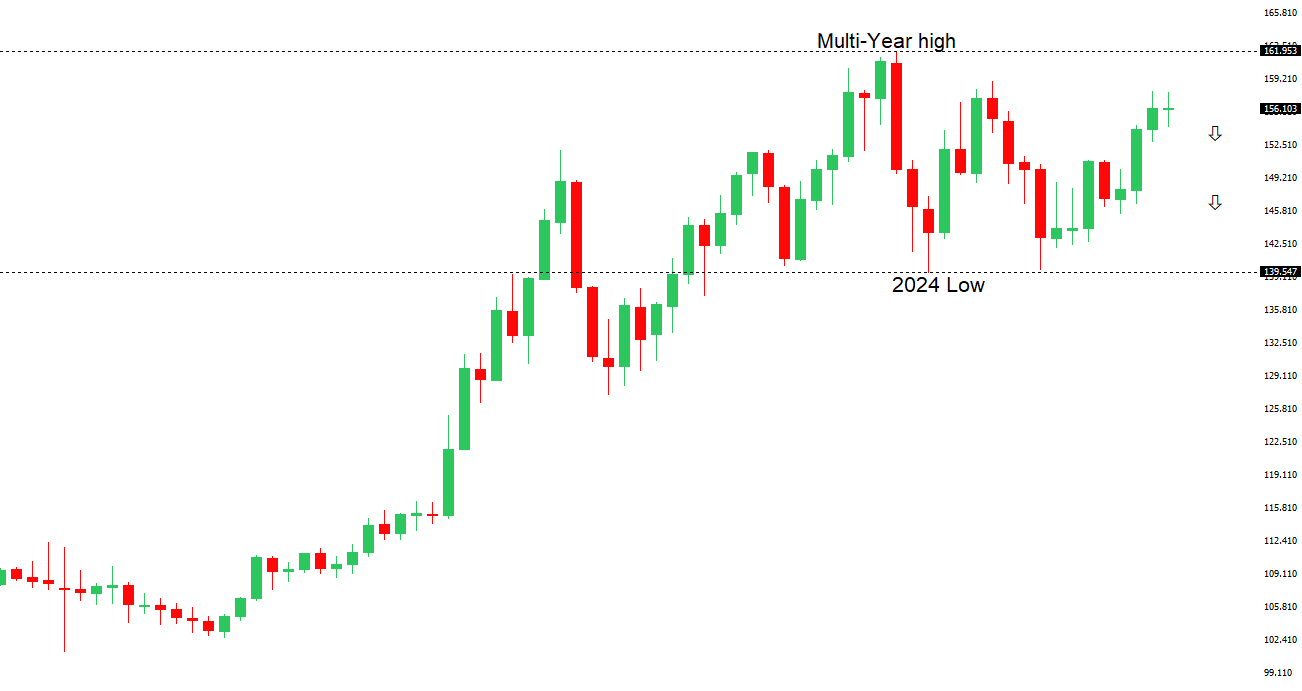 | ||
| R2 157.90 - 20 November/2025 high - Strong R1 157.00 - Figure - Medium S1 154.39 - 16 December low - Strong S2 153.61 - 14 November low - Medium | ||
| USDJPY: fundamental overview | ||
| The yen has pulled back from recent highs as repeated warnings from Japanese officials about possible FX intervention limited gains, while a weaker US dollar—on expectations of Fed rate cuts—offered some support. Japan’s 10-year bond yield slipped to 2.02% from record levels after the BoJ’s recent rate hike, with markets weighing the impact of a record-sized FY2026 budget that will require more bond issuance and awaiting policy clues from Governor Ueda’s upcoming speech. Recent BoJ minutes pointed to a steady but moderate economic recovery, inflation led by food prices, and ongoing global risks, while today’s data showed stable service-sector inflation and economic indicators consistent with steady growth momentum. | ||
| AUDUSD: technical overview | ||
| There are signs of the potential formation of a longer-term base with the market trading down into a meaningful longer-term support zone. Only a monthly close below 0.5500 would give reason for rethink. A monthly close back above 0.7000 will take the big picture pressure off the downside and strengthen case for a bottom. | ||
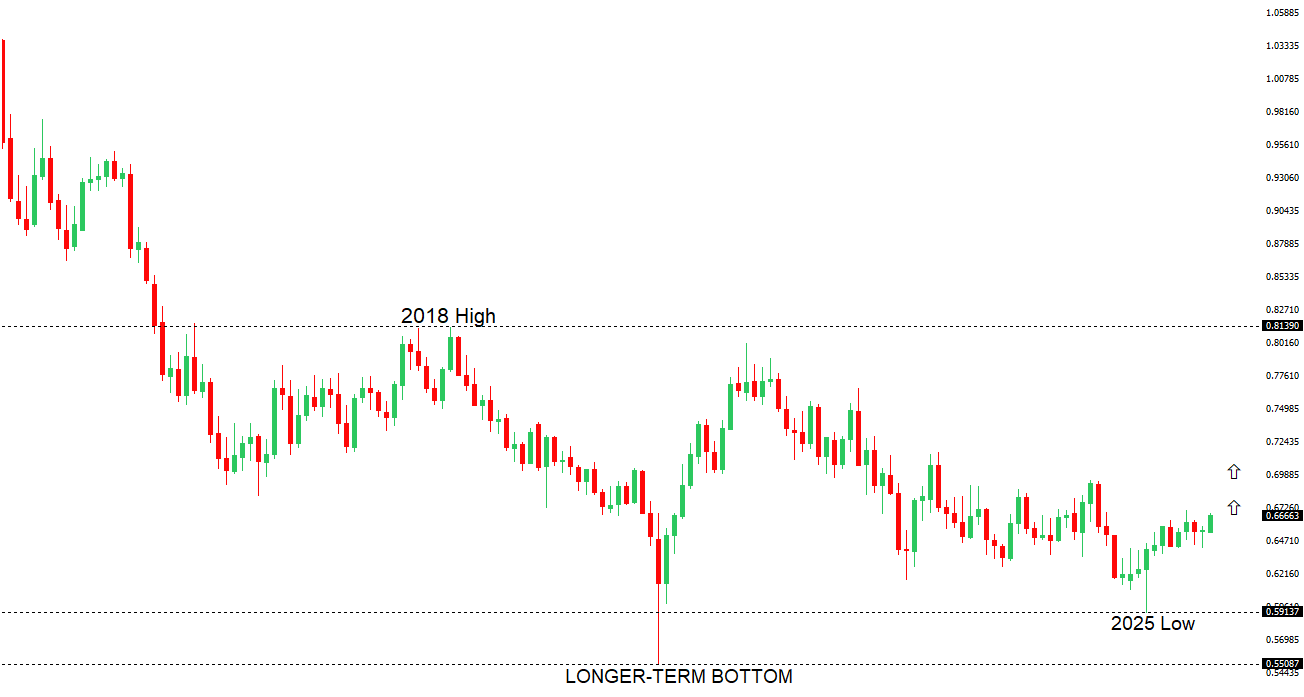 | ||
| R2 0.6800 - Figure - Medium R1 0.6718 - 24 December/2025 high - Medium S1 0.6592 - 18 December low - Medium S2 0.6421 - 21 November low - Strong | ||
| AUDUSD: fundamental overview | ||
| The Australian dollar has extended its run to the highest level since late October. Minutes from the RBA’s December meeting showed officials discussing the possibility of a rate hike in 2026 as inflation and labor market conditions are reviewed, with headline inflation at 3.8% in October still above target and fueling expectations of a February hike. Meanwhile, Australia’s 10-year bond yield stayed elevated around 4.741% with little daily change. | ||
| Suggested reading | ||
| Will Prediction Markets Render Stock Markets Obsolete?, A. Welsch, Barron’s (December 18, 2025) Biggest Investing Lesson of 2025, What to Look For In 2026, C. Reilly, RiskHedge (December 22, 2025) | ||