


 | ||
| 23rd December 2025 | view in browser | ||
| Markets pivot on widening policy gaps | ||
| Global markets head into the new day with central bank divergence firmly in focus, led by an increasingly split Federal Reserve after Governor Miran warned that failing to keep cutting rates in 2025 risks triggering a recession, pushing the dollar lower and reinforcing market expectations for deeper easing than the Fed’s own projections. | ||
| Performance chart 30day v. USD (%) | ||
 | ||
| Technical & fundamental highlights | ||
| EURUSD: technical overview | ||
| The Euro outlook remains constructive with higher lows sought out on dips in favor of the next major upside extension targeting the 2021 high at 1.2350. Setbacks should be exceptionally well supported ahead of 1.1400. | ||
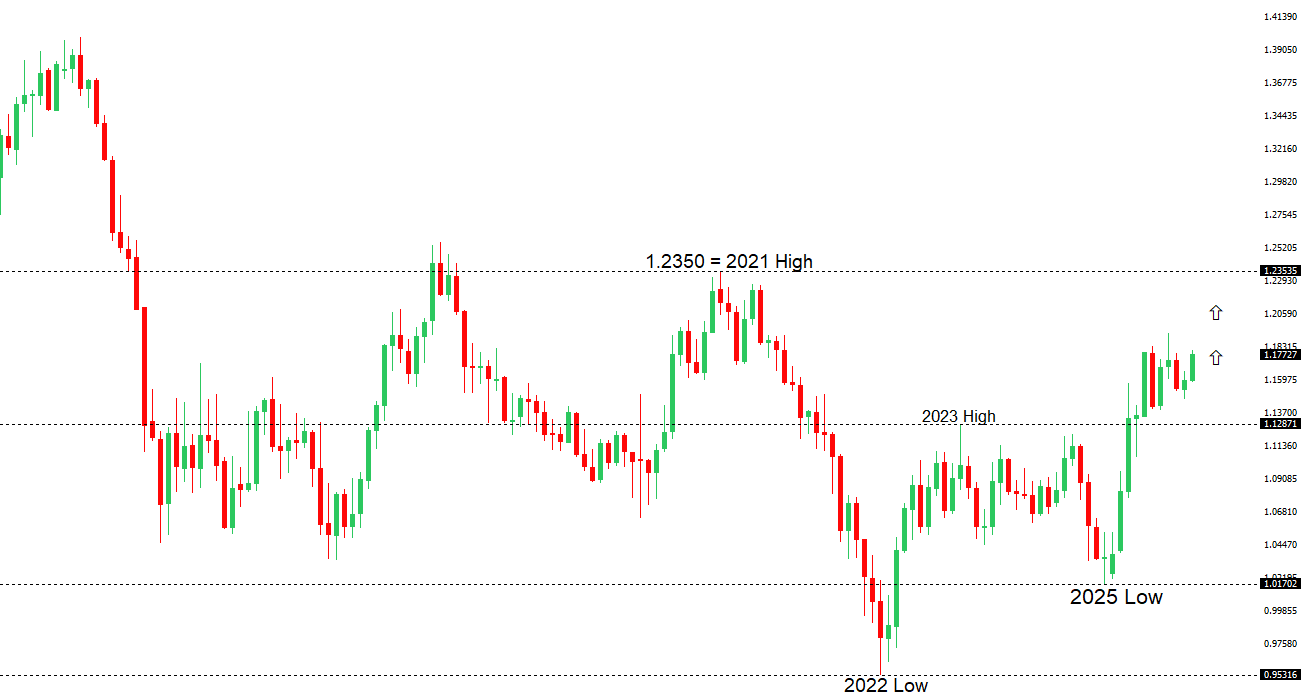 | ||
| R2 1.1919 - 17 September/2025 high -Strong R1 1.1805 - 16 December high - Medium S1 1.1703 - 19 December low - Strong S2 1.1615 - 9 December low - Strong | ||
| EURUSD: fundamental overview | ||
| The euro remains supported by the ECB’s steady policy stance, rates holding near 2%, and improving eurozone external balances, keeping the currency close to its strongest levels since late September. Market focus now shifts to Germany’s import price data, expected to show easing inflation pressures, and Spain’s GDP and PPI releases, which are forecast to confirm stable growth alongside only moderate producer price inflation. | ||
| USDJPY: technical overview | ||
| There are signs of a meaningful top in place after the market put in a multi-year high in 2024. At this point, rallies should be well capped ahead of 160.00 ahead of a fresh down-leg back towards the 2024 low at 139.58. | ||
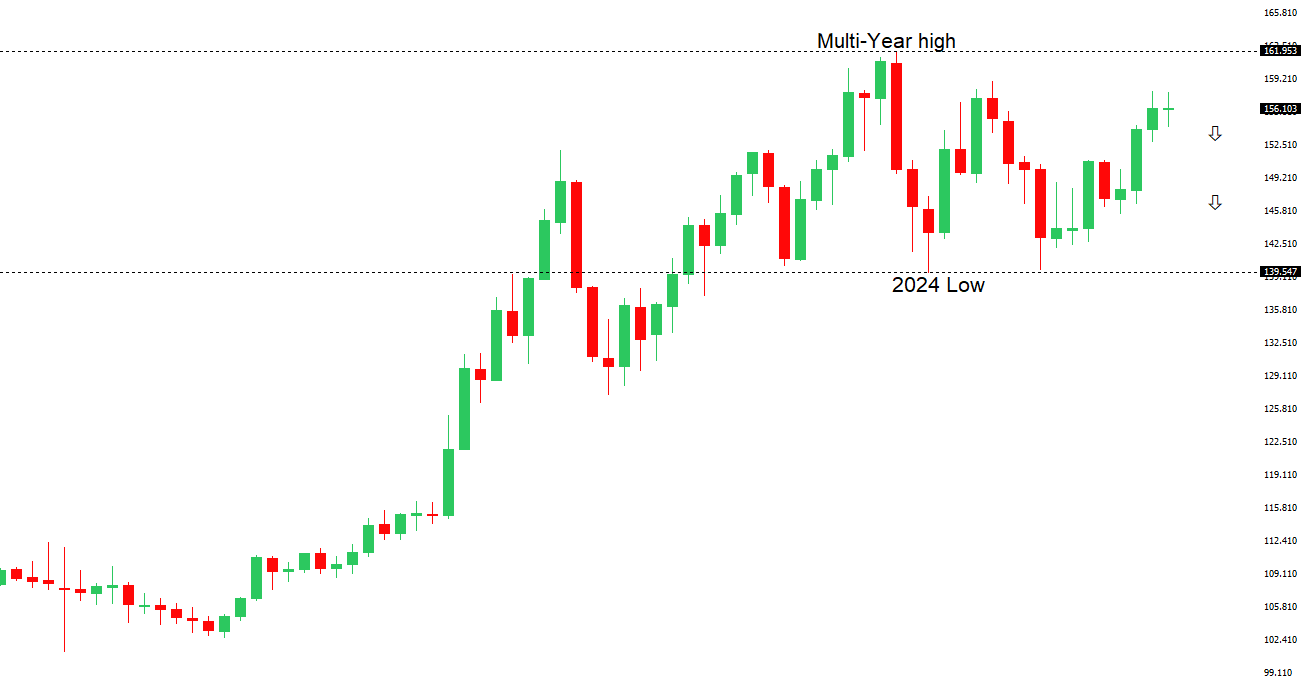 | ||
| R2 157.90 - 20 November/2025 high - Strong R1 157.00 - Figure - Medium S1 154.39 - 16 December low - Strong S2 153.61 - 14 November low - Medium | ||
| USDJPY: fundamental overview | ||
| The yen has seen some choppy trading triggered by strong intervention warnings from Japan’s finance minister, who stressed the authorities’ freedom to act against speculative moves and noted shared understanding with the US on intervening during excessive volatility. The comments came as Japanese yields surged, with the 10-year JGB hitting a 27-year high near 2.1% on expectations of further BOJ tightening and heavy fiscal spending under a record budget. On the data front, Japan’s November machine tool orders are expected to show solid momentum, with year-on-year growth forecast at around 14%. | ||
| AUDUSD: technical overview | ||
| There are signs of the potential formation of a longer-term base with the market trading down into a meaningful longer-term support zone. Only a monthly close below 0.5500 would give reason for rethink. A monthly close back above 0.7000 will take the big picture pressure off the downside and strengthen case for a bottom. | ||
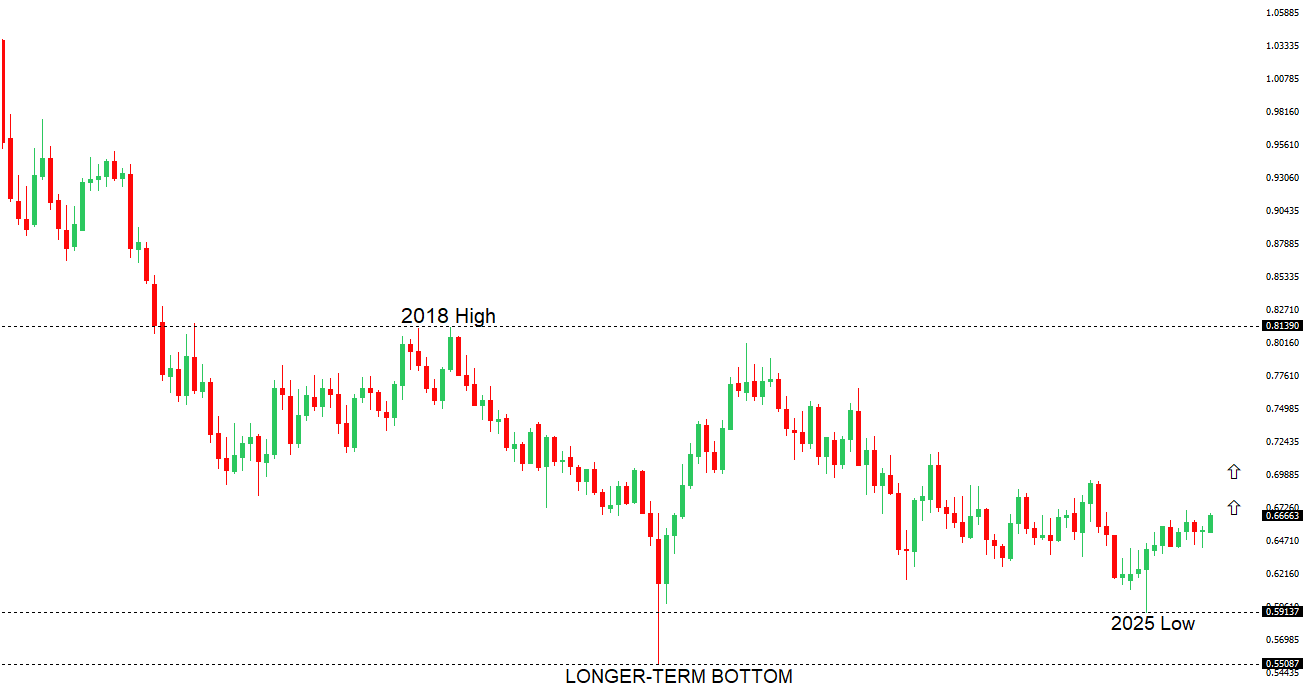 | ||
| R2 0.6707 - 17 September/2025 high - Strong R1 0.6686 - 10 December high - Medium S1 0.6592 - 18 December low - Medium S2 0.6421 - 21 November low - Strong | ||
| AUDUSD: fundamental overview | ||
| The Australian dollar has been better bid after the RBA minutes highlighted ongoing inflation risks and left the door open to further tightening in 2026, giving policy a mildly hawkish tone despite rates staying on hold. Support also came from steady Chinese rates and improved risk sentiment, though softer commodity prices and weak global demand remain a drag, with Australia’s commodity price index falling sharply year on year. Bond yields remain elevated and markets are increasingly pricing the risk of a rate hike later in the first half of the year. | ||
| Suggested reading | ||
| Scammers, spies and triads: inside cyber-crime’s $15tn global empire, B. Marino, FT (December 18, 2025) How Credit Is Produced By Lenders And Borrowers, J. Tamny, Forbes (December 21, 2025) | ||