


 | ||
| 11th March 2026 | view in browser | ||
| Macro focus shifts to US inflation | ||
| Markets begin the day cautiously as investors assess rising geopolitical tensions, developments in oil markets, and the upcoming US CPI inflation report. | ||
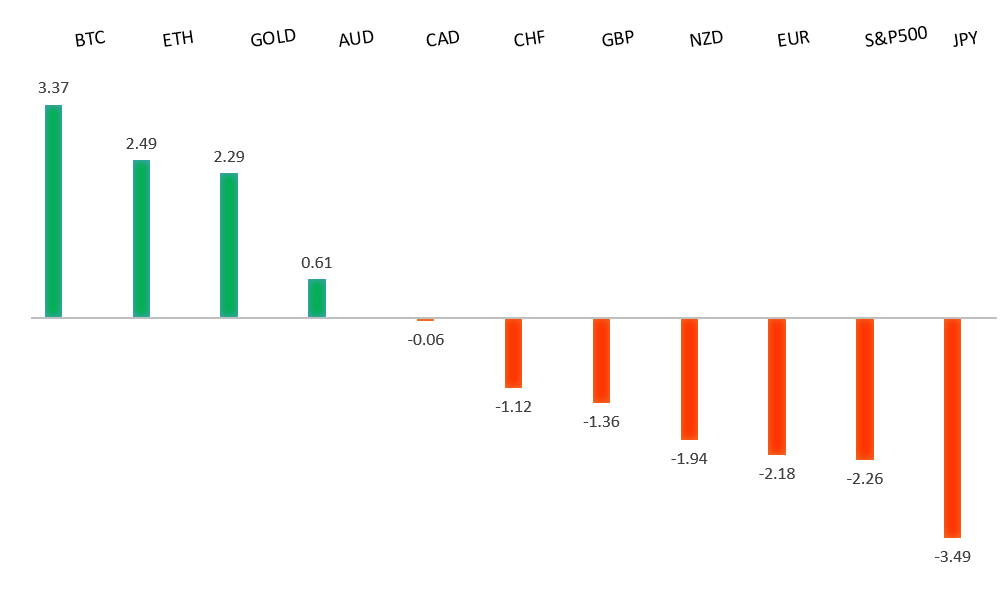
| Performance chart 30day v. USD (%) | ||
 | ||
| Technical & fundamental highlights | ||
| EURUSD: technical overview | ||
| The Euro outlook remains constructive with higher lows sought out on dips in favor of the next major upside extension targeting the 2021 high at 1.2350. Setbacks should be exceptionally well supported ahead of 1.1400. | ||
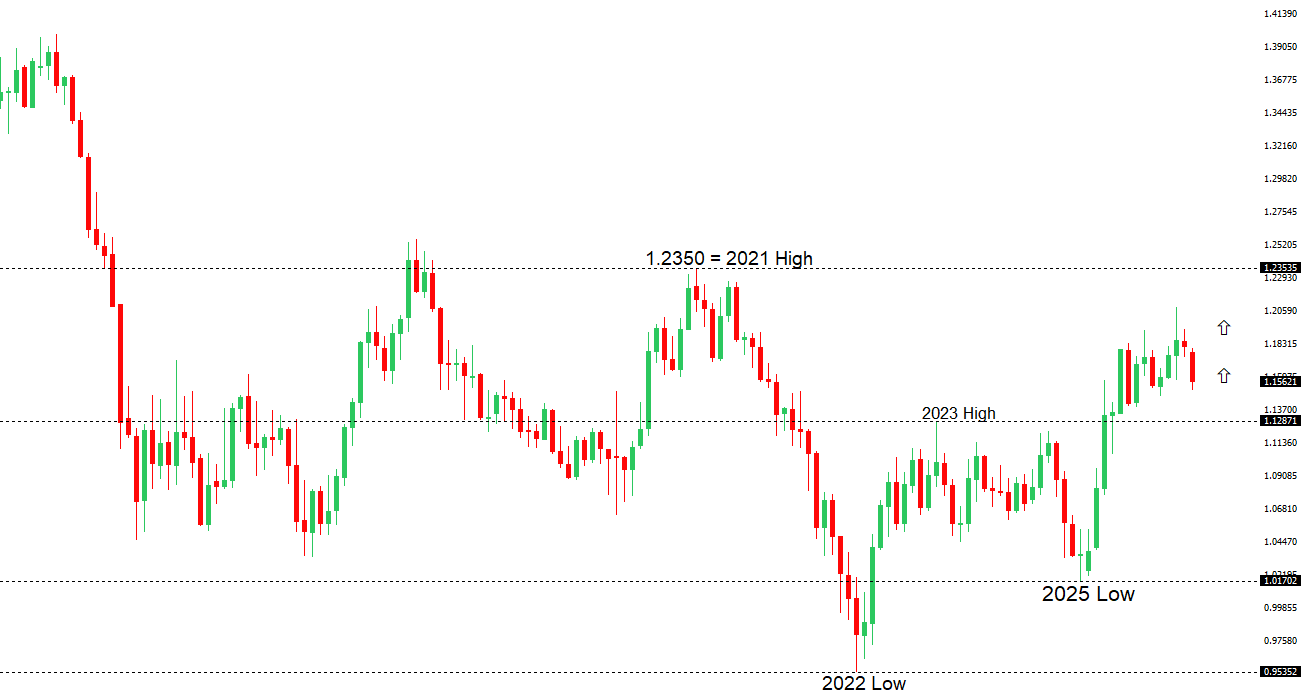 | ||
| R2 1.1707 - 3 March high - Strong R1 1.1668 - 10 March high - Medium S1 1.1507 - 9 March/2026 low - Medium S2 1.1469 - 5 November low - Strong | ||
| EURUSD: fundamental overview | ||
| The euro has recovered most of Tuesday’s losses. ECB President Christine Lagarde signaled that the euro area is better positioned than in 2022–23 to handle an Iran-related energy shock, while emphasizing the ECB will act if rising energy costs threaten to push inflation meaningfully above its 2% target. Markets briefly priced in nearly two rate hikes for 2026 after the oil spike, but expectations have since eased to less than one hike as de-escalation headlines emerged and policymakers reinforced a cautious “wait-and-see” stance. Overall, ECB officials suggest they will tolerate near-term volatility but remain ready to respond if higher energy prices begin feeding into wages and services inflation, leaving policy risks slightly tilted toward tighter settings if the shock proves persistent. | ||
| USDJPY: technical overview | ||
| There are signs of the formation of a meaningful top after the market put in a multi-year high in 2024. At this point, rallies should be well capped ahead of 160.00 in favor of a fresh down-leg back towards the 2024 low at 139.58. | ||
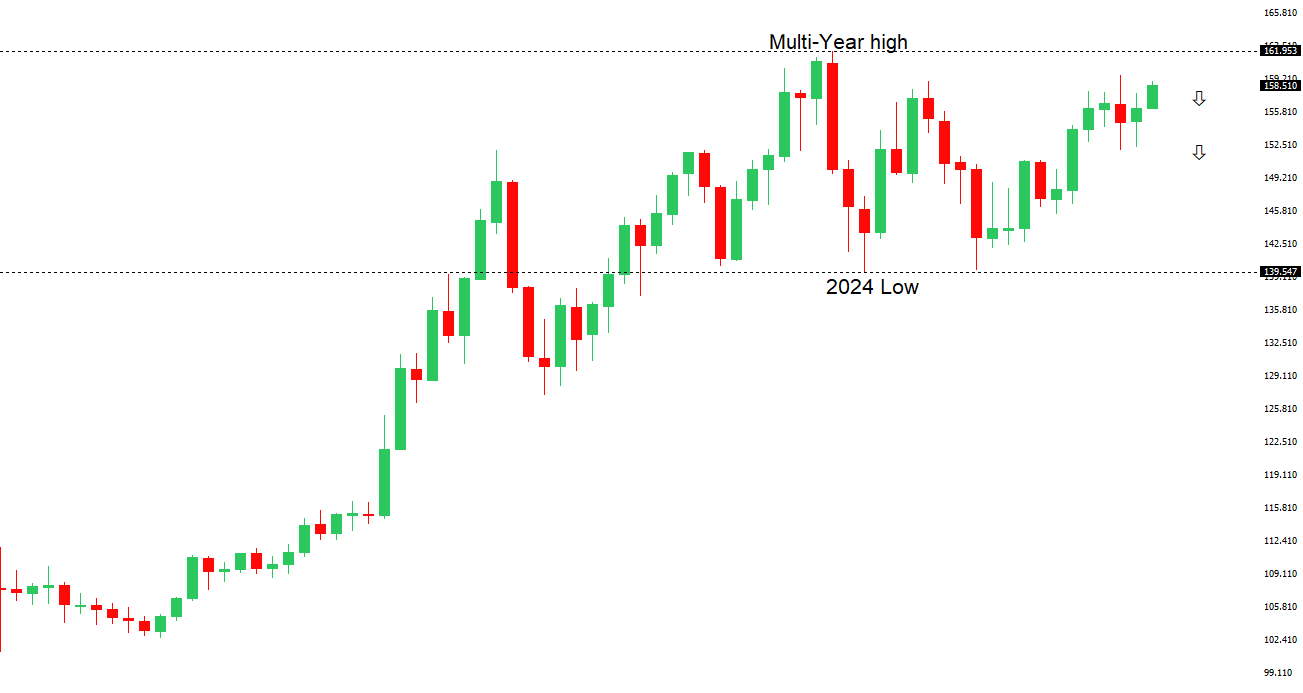 | ||
| R2 159.46 - 14 January/2026 high - Strong R1 158.91 - 9 March high - Medium S1 156.45 - 5 March low - Medium S2 155.34 - 25 February low - Medium | ||
| USDJPY: fundamental overview | ||
| The yen remains under pressure against the dollar, with USDJPY approaching Monday’s 6.5-week high near 158.9. Softer February PPI data — up 2.0% YoY and down 0.1% MoM — suggests some easing in upstream price pressures, though producer inflation remains relatively elevated overall. While the BOJ has only recently lifted rates to 0.75% and continues to signal the possibility of further hikes, Japan’s expansionary fiscal stance, improving growth, and efforts to sustain inflation through wage gains point to ongoing medium-term yen weakness. Near-term direction will largely hinge on oil prices and the Iran conflict, with volatility in energy markets influencing BOJ expectations; however, even if tensions ease and markets price an April hike, structural factors are expected to limit USDJPY downside. | ||
| AUDUSD: technical overview | ||
| There are signs of the formation of a longer-term base with the market recovering out from a meaningful longer-term support zone. The latest monthly close back above 0.7000 takes the big picture pressure off the downside and strengthens the case for a bottom, with the focus now on a push towards 0.8000. Setbacks should now be well supported ahead of 0.6700. | ||
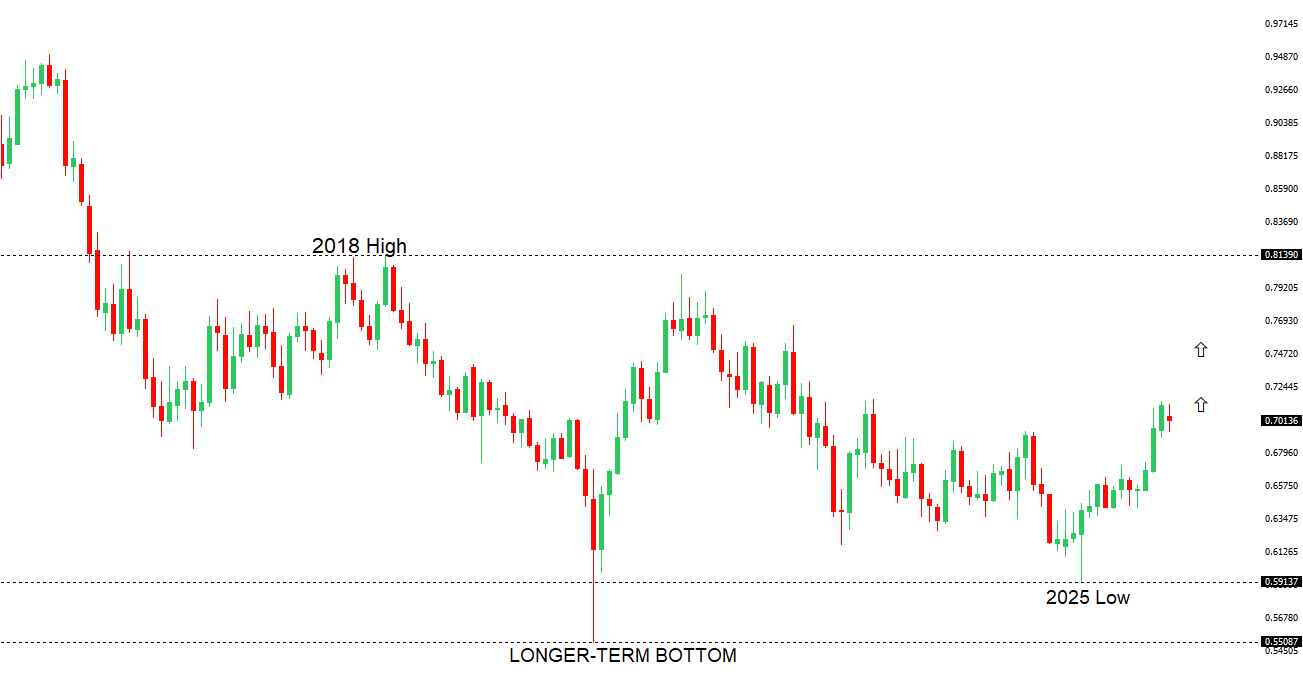 | ||
| R2 0.7200 - Figure - Medium R1 0.7186 - 11 March/2026 high - Medium S1 0.6944 - 3 March low - Medium S2 0.6897 - 6 February low - Strong | ||
| AUDUSD: fundamental overview | ||
| The Australian dollar is the top performer today, reaching a new year-to-date high. The move follows hawkish comments from RBA Deputy Governor Andrew Hauser, who warned that the economy has limited spare capacity and that rising oil prices linked to the Iran conflict could add to inflation pressures. Markets have sharply increased expectations for further tightening, now pricing about a 65% chance of a 25bp rate hike at the March 17 RBA meeting and roughly 58bp of hikes over the rest of the year. | ||
| Suggested reading | ||
| As Sentiment Declines, Stock Market Upside Rises, Fisher Investments (March 6, 2026) The Fed Has A Big Problem On Their Hands, S. Varghese, Carson Group (March 6, 2026) | ||