


 | ||
| 12th May 2026 | view in browser | ||
| Markets on edge ahead of US CPI | ||
| Markets are turning more defensive with the Dollar and oil supported as worsening US-Iran tensions lift inflation risks, while focus shifts to today’s key US CPI release for direction. | ||
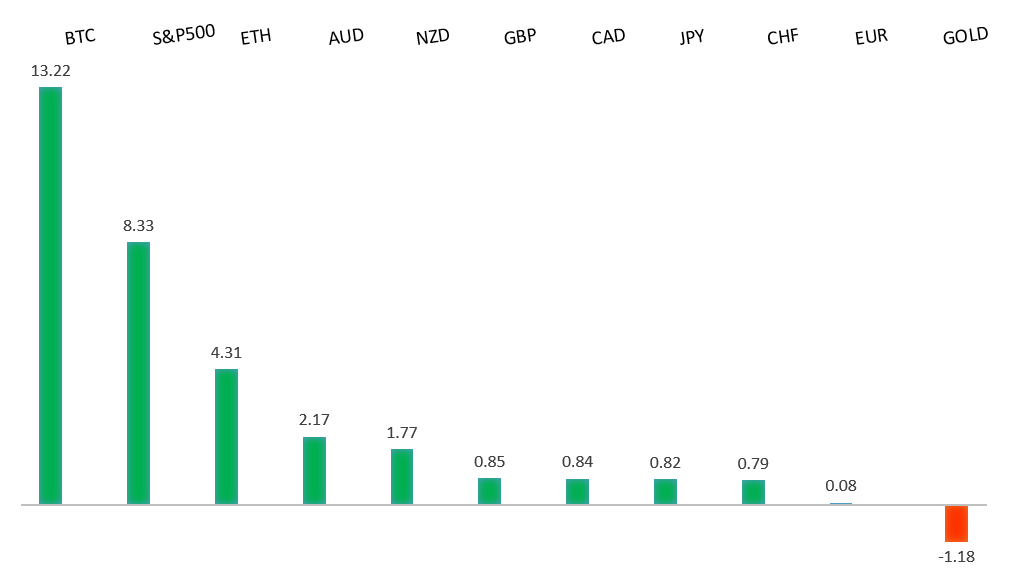
| Performance chart 30day v. USD (%) | ||
 | ||
| Technical & fundamental highlights | ||
| EURUSD: technical overview | ||
| The Euro outlook remains constructive with higher lows sought out on dips in favor of the next major upside extension targeting the 2021 high at 1.2350. Setbacks should be exceptionally well supported ahead of 1.1300. | ||
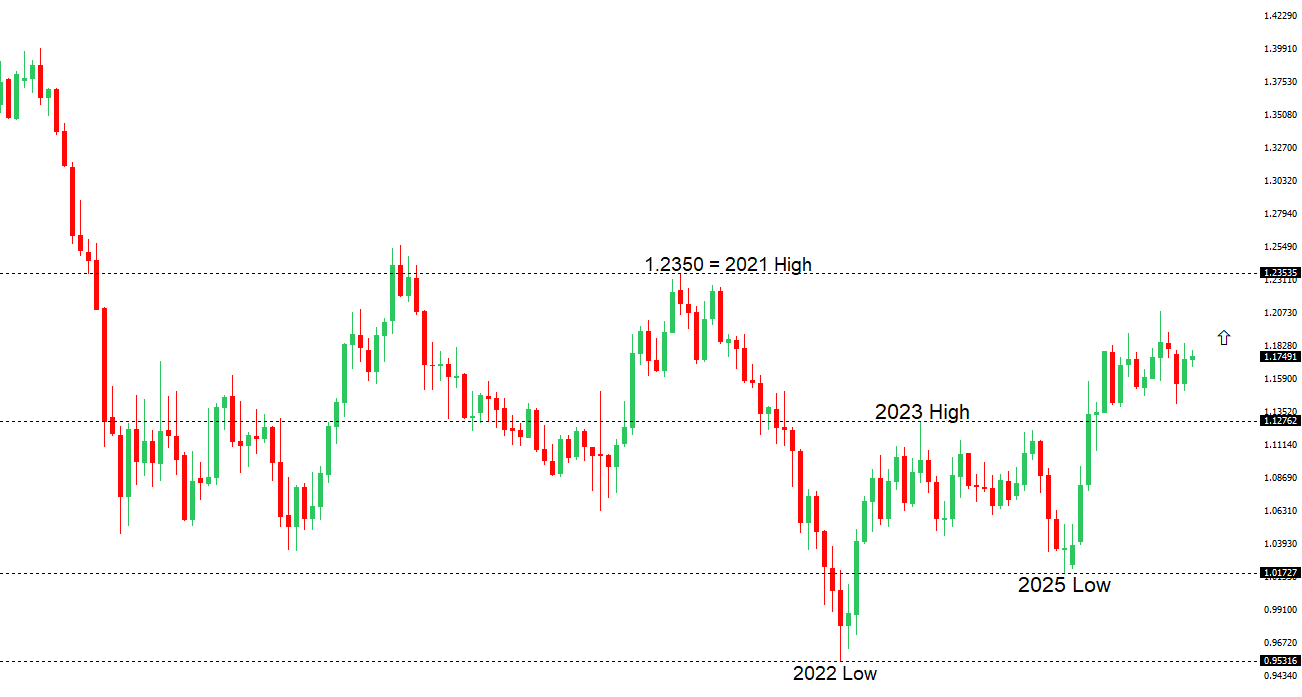 | ||
| R2 1.1850 - 17 April high - Strong R1 1.1797 - 6 May high - Medium S1 1.1650 - 9 April low - Medium S2 1.1589 - 8 April low - Strong | ||
| EURUSD: fundamental overview | ||
| The Euro is trading with a softer near-term bias, primarily driven by external factors, with renewed geopolitical tensions and event risk around US inflation supporting the US Dollar and weighing on EURUSD. Concerns that the fragile US-Iran ceasefire may deteriorate, highlighted by increasingly hawkish rhetoric from both sides, are underpinning safe-haven demand for the greenback, while markets also turn cautious ahead of key US CPI data, reinforcing a more defensive tone. Against this, the European Central Bank continues to offer an important offset, maintaining a clearly hawkish stance as policymakers signal little willingness to delay further tightening in the face of elevated energy-driven inflation. Markets are now pricing a high probability of a June rate hike, with additional tightening expected through 2026, helping to limit downside in the Euro. At the same time, the currency is finding relative support on crosses, particularly against the Yen, where policy divergence with the Bank of Japan remains pronounced. Overall, the Euro is being pulled in opposing directions—supported by a firm policy outlook but pressured by global risk dynamics and Dollar strength—leaving it largely reactive to external drivers rather than domestic momentum. | ||
| USDJPY: technical overview | ||
| There are signs of the formation of a meaningful top after the market put in a multi-year high in 2024. At this point, rallies should be well capped above 160.00 in favor of a fresh down-leg back towards the 2024 low at 139.58. Only a monthly close above 160.00 negates. | ||
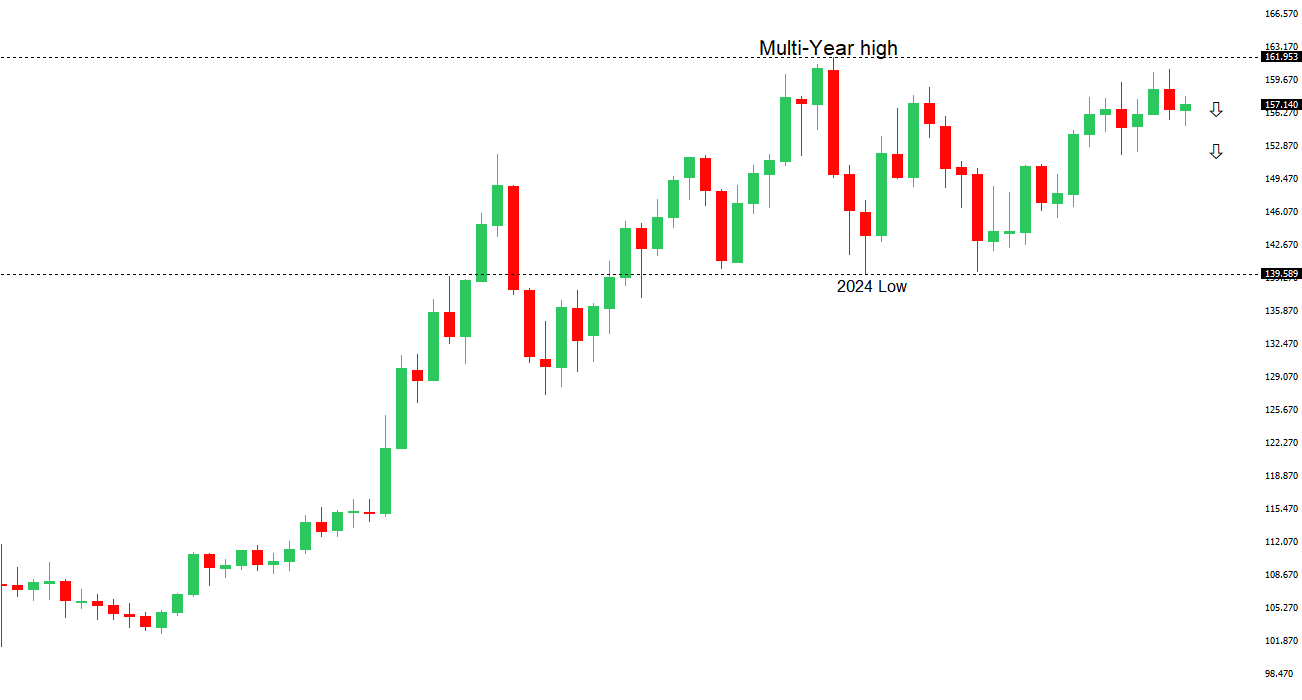 | ||
| R2 159.53 - 17 April low - Medium R1 157.93 - 6 May high - Medium S1 156.00 - Figure - Medium S2 155.02 - 6 May low - Strong | ||
| USDJPY: fundamental overview | ||
| The Yen remains under pressure, with recent price action driven by a combination of soft domestic data, external risk dynamics, and ongoing policy divergence. The latest downside catalyst has been weaker household spending, which has now declined for a fourth consecutive month, underscoring the strain from persistent inflation on consumer demand and raising concerns about the durability of Japan’s domestic recovery. At the same time, renewed tensions in the Middle East are supporting the US Dollar through safe-haven demand and higher energy prices—both negative for Japan given its reliance on imported fuel—adding further downside pressure on the Yen. While the Bank of Japan is gradually shifting toward a more hawkish stance, with some policymakers signaling openness to additional rate hikes, this is being offset by still-wide yield differentials versus the US, which continue to favor carry trades. Intervention dynamics also remain in play, with Japanese officials maintaining a strong presence and signaling readiness to act, helping to limit excessive weakness but not fundamentally reverse the trend. As a result, the Yen remains caught between intermittent policy support and persistent structural headwinds, leaving it vulnerable overall while prone to bouts of volatility. | ||
| AUDUSD: technical overview | ||
| There are signs of the formation of a longer-term base with the market recovering out from a meaningful longer-term support zone. The latest monthly close back above 0.7000 takes the big picture pressure off the downside and strengthens the case for a bottom, with the focus now on a push towards 0.8000. Setbacks should now be well supported ahead of 0.6700. | ||
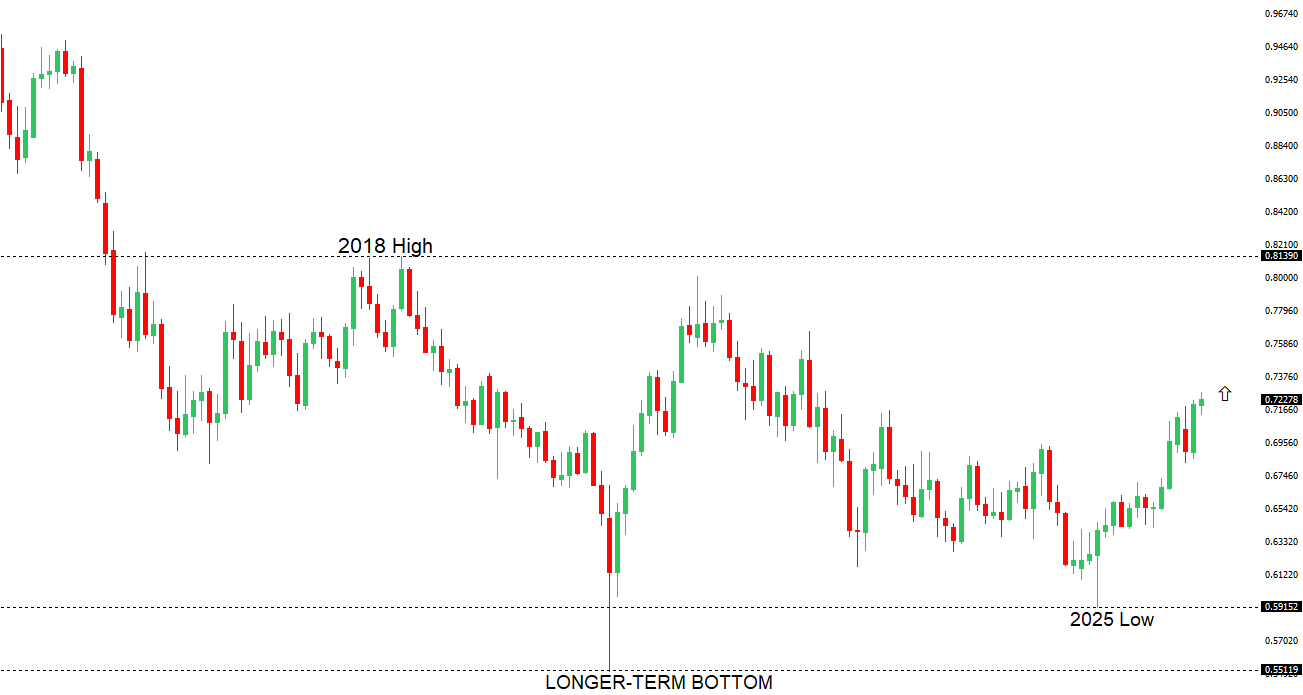 | ||
| R2 0.7300 - Figure - Medium R1 0.7278 - 6 May/2026 high - Medium S1 0.7101 - 30 April low - Medium S2 0.6963 - 8 April low - Strong | ||
| AUDUSD: fundamental overview | ||
| The Australian Dollar is coming under pressure as domestic fundamentals deteriorate, even as the broader macro backdrop remains mixed. The latest business survey data points to a clear slowdown in activity, with confidence still deeply negative and forward-looking indicators such as orders and capital expenditure falling sharply, signaling weaker growth ahead. At the same time, elevated energy costs linked to the Middle East conflict are creating a pronounced squeeze on corporate margins, with input costs rising much faster than selling prices, reinforcing a stagflationary dynamic. This leaves the Reserve Bank of Australia in a difficult position: while softer activity argues for patience, rising retail price pressures and the risk of second-round inflation effects mean policy is likely to remain restrictive. As a result, although higher rates continue to provide some support, the Aussie is increasingly weighed down by weakening domestic momentum and remains highly sensitive to external drivers such as global risk sentiment, commodity prices, and US Dollar direction. | ||
| Suggested reading | ||
| “Return of Investment” Different From “Return On,” Fisher Investments (May 7, 2026) 6 Undervalued Stocks That Just Raised Dividends, B. Albrecht, Morningstar (May 7, 2026) | ||