


 | ||
| 11th May 2026 | view in browser | ||
| Geopolitics bite back | ||
| Markets have shifted back into a cautious risk-off tone, with the Dollar and oil higher as renewed Middle East tensions reintroduce inflation risks and challenge the recent risk rally. | ||
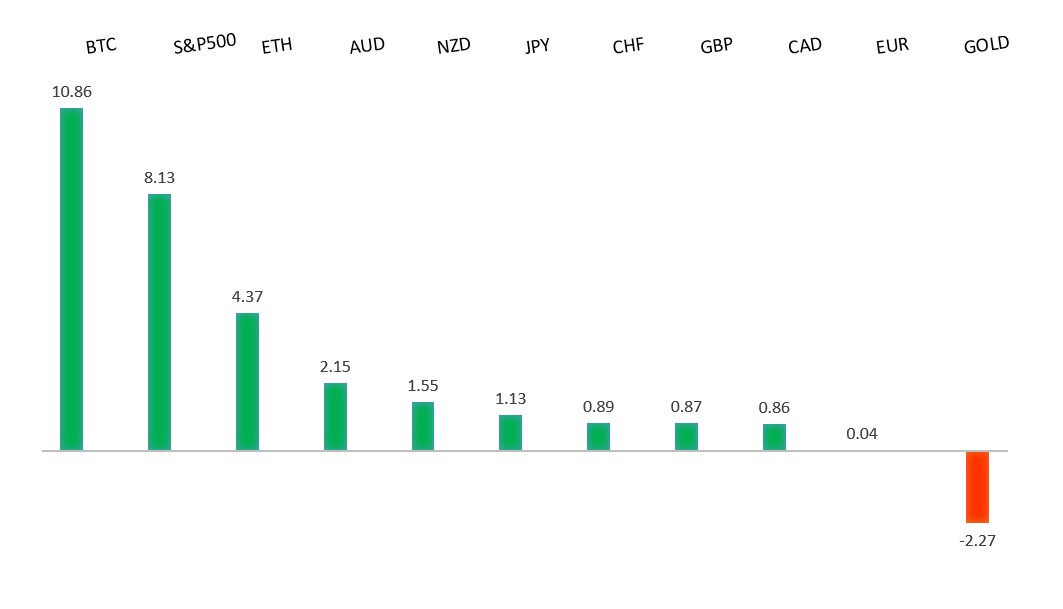
| Performance chart 30day v. USD (%) | ||
 | ||
| Technical & fundamental highlights | ||
| EURUSD: technical overview | ||
| The Euro outlook remains constructive with higher lows sought out on dips in favor of the next major upside extension targeting the 2021 high at 1.2350. Setbacks should be exceptionally well supported ahead of 1.1300. | ||
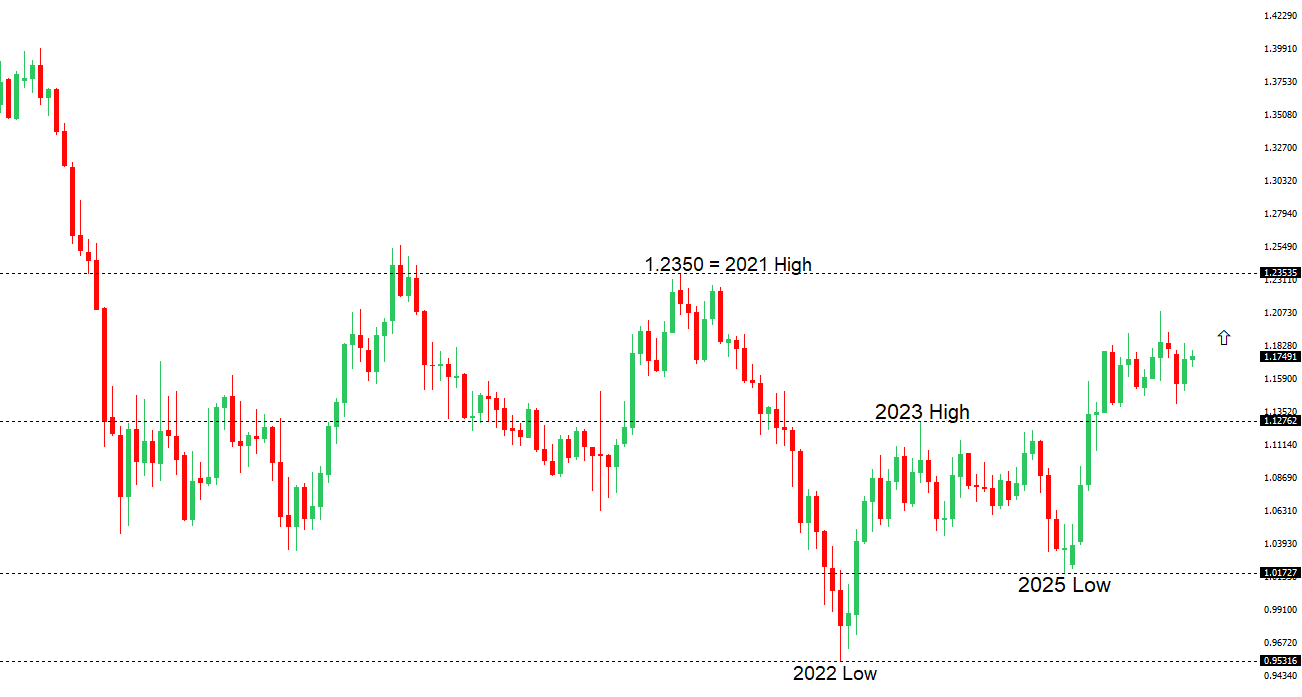 | ||
| R2 1.1850 - 17 April high - Strong R1 1.1797 - 6 May high - Medium S1 1.1650 - 9 April low - Medium S2 1.1589 - 8 April low - Strong | ||
| EURUSD: fundamental overview | ||
| The Euro is trading with a softer bias, primarily weighed down by a firmer US Dollar as geopolitical tensions re-escalate and risk aversion returns to the forefront. Renewed uncertainty around the US-Iran situation—following a breakdown in tone around negotiations and ongoing concerns over the Strait of Hormuz—has revived safe-haven demand for the greenback, putting downside pressure on EURUSD. This Dollar strength has been reinforced by a resilient US labor market backdrop, with the latest payrolls data coming in stronger than expected and helping to anchor expectations for a still-restrictive Federal Reserve policy stance. On the European side, the European Central Bank continues to provide some underlying support, with markets still pricing additional rate hikes amid persistent inflation pressures, which is helping to limit deeper losses in the single currency. However, this support is being offset by a relatively weaker growth outlook in the Eurozone and ongoing external risks, including trade tensions and global uncertainty. As a result, the Euro remains largely driven by external dynamics—particularly USD strength and shifts in risk sentiment—leaving it vulnerable in the near term despite a still-hawkish policy backdrop. | ||
| USDJPY: technical overview | ||
| There are signs of the formation of a meaningful top after the market put in a multi-year high in 2024. At this point, rallies should be well capped above 160.00 in favor of a fresh down-leg back towards the 2024 low at 139.58. Only a monthly close above 160.00 negates. | ||
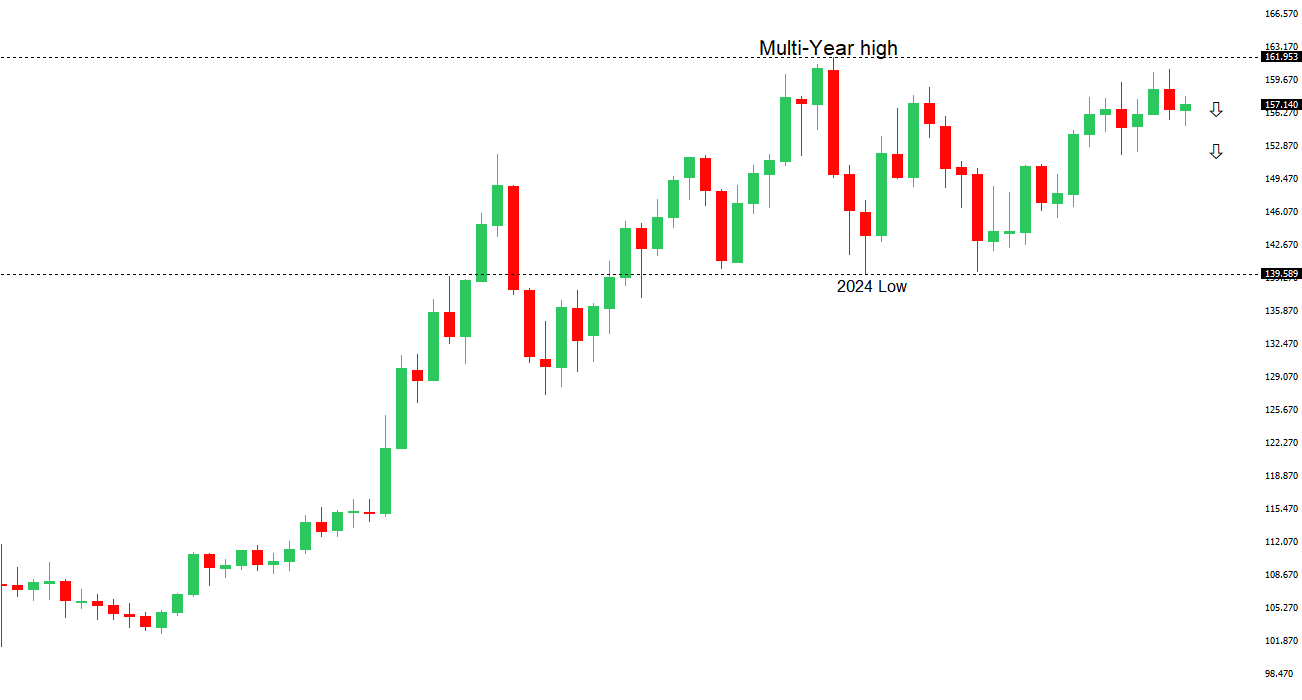 | ||
| R2 159.53 - 17 April low - Medium R1 157.93 - 6 May high - Medium S1 156.00 - Figure - Medium S2 155.02 - 6 May low - Strong | ||
| USDJPY: fundamental overview | ||
| The Yen remains fundamentally pressured, with recent price action reflecting a familiar tug-of-war between structural headwinds and intermittent policy support. In the near term, renewed Middle East tensions—following the rejection of a proposed US-Iran peace deal—have pushed oil prices higher and reinforced safe-haven demand for the US Dollar. This dynamic is particularly negative for Japan given its heavy reliance on energy imports, with elevated oil prices worsening the country’s terms of trade and weighing on the Yen. At the same time, yield differentials remain a key driver, with a still-restrictive Federal Reserve stance contrasting with the relatively accommodative posture of the Bank of Japan, sustaining demand for carry trades. Against this backdrop, Japanese authorities continue to lean against excessive currency weakness, with repeated intervention and strong verbal warnings from officials such as Atsushi Mimura helping to cap upside in USDJPY and inject volatility into the pair. However, intervention is largely seen as a short-term tool to smooth moves rather than reverse the trend, leaving the Yen vulnerable overall as long as external pressures—particularly energy costs and rate differentials—remain in place. | ||
| AUDUSD: technical overview | ||
| There are signs of the formation of a longer-term base with the market recovering out from a meaningful longer-term support zone. The latest monthly close back above 0.7000 takes the big picture pressure off the downside and strengthens the case for a bottom, with the focus now on a push towards 0.8000. Setbacks should now be well supported ahead of 0.6700. | ||
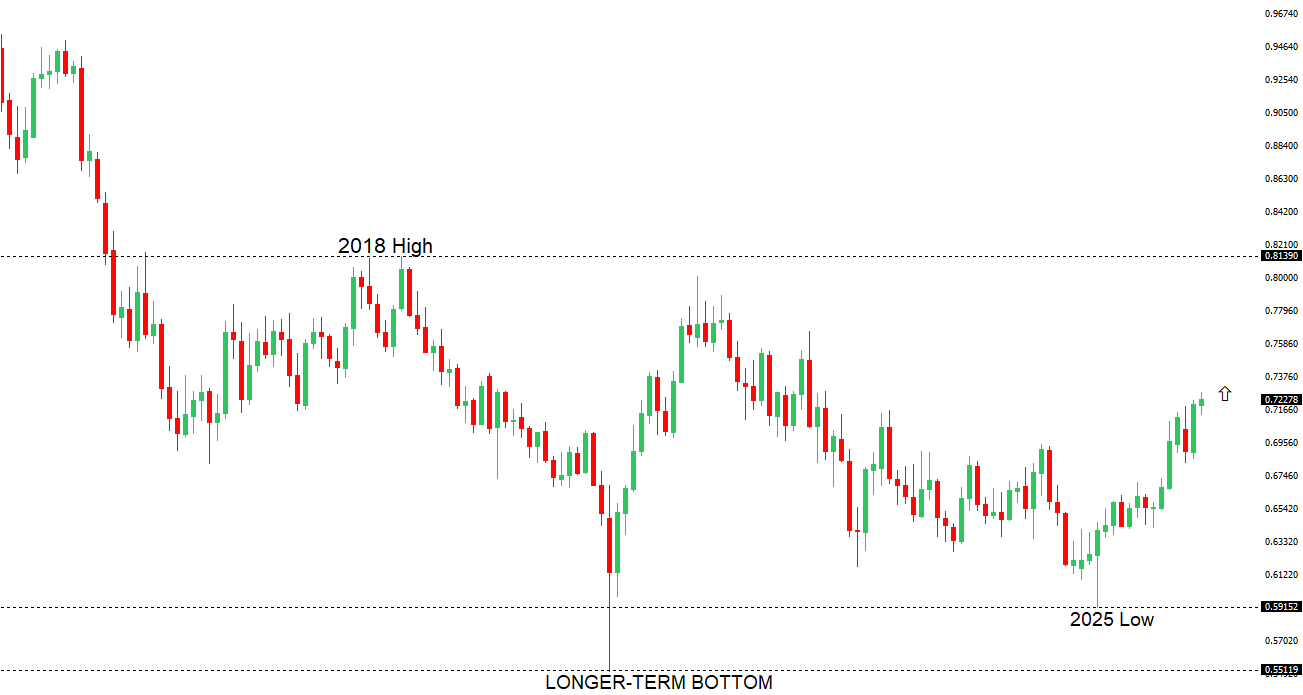 | ||
| R2 0.7300 - Figure - Medium R1 0.7278 - 6 May/2026 high - Medium S1 0.7101 - 30 April low - Medium S2 0.6963 - 8 April low - Strong | ||
| AUDUSD: fundamental overview | ||
| The Australian Dollar is being pulled in two directions, with underlying support from a still-hawkish domestic policy backdrop offset by external headwinds from global risk dynamics and a firmer US Dollar. On the one hand, the Reserve Bank of Australia continues to underpin the currency, having delivered a third consecutive rate hike to 4.35% and maintaining a tightening bias, with markets still pricing further increases toward the mid-4% range over time as inflation remains elevated, in part due to higher energy costs linked to Middle East tensions. This keeps Australian yields relatively attractive and supports crosses such as AUDJPY. However, the broader AUDUSD performance is more mixed, as renewed geopolitical uncertainty—particularly the breakdown in US-Iran negotiations—has lifted safe-haven demand for the US Dollar and weighed on risk-sensitive currencies. At the same time, stronger US data, including a resilient payrolls print, has reinforced expectations for a still-restrictive Federal Reserve, further supporting the USD. From a regional perspective, China data has shown signs of firmer inflation, offering some support to the Aussie given strong trade linkages, though not enough to fully offset global headwinds. As a result, the Australian Dollar remains supported on a relative yield basis but ultimately continues to trade as a proxy for global risk sentiment and USD direction, leaving it vulnerable in periods of heightened uncertainty despite its constructive domestic backdrop. | ||
| Suggested reading | ||
| UBS’s Sergio Ermotti on Swiss plans for stringent capital requirements, R. Khalaf, FT (May 8, 2026) Why It’s So Hard to Spot a Stock-Market Bubble, J. Zweig, Wall Street Journal (May 8, 2026) | ||