


 | ||
| 8th May 2026 | view in browser | ||
| Waiting on payrolls, watching the world | ||
| Markets are trading cautiously into Friday with the Dollar stabilizing and risk assets pausing as geopolitical uncertainty lingers, while attention turns squarely to today’s US nonfarm payrolls report for the next directional catalyst. | ||
| Performance chart 30day v. USD (%) | ||
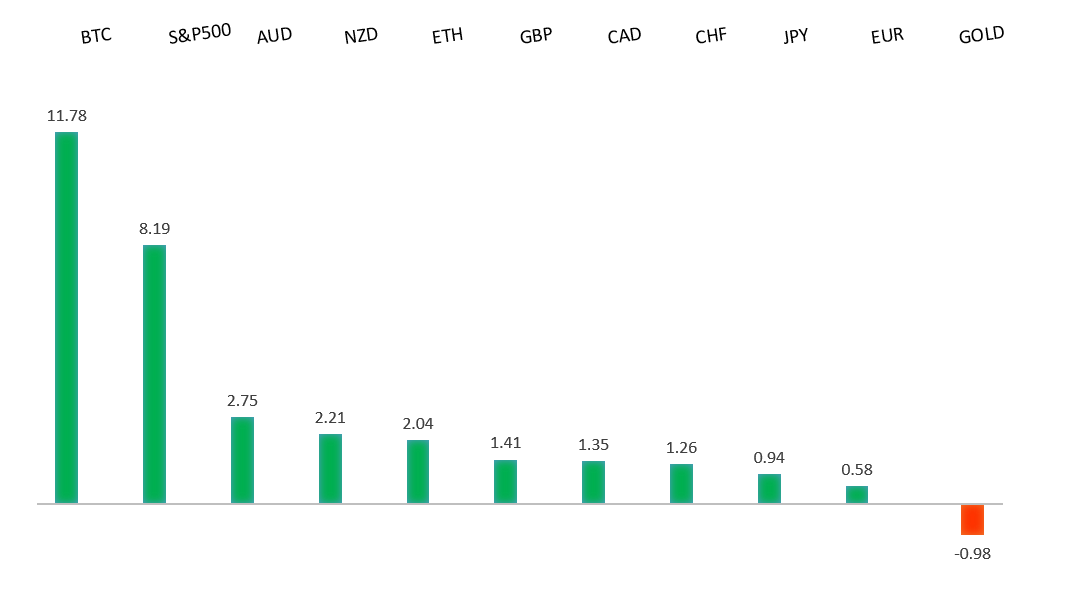 | ||
| Technical & fundamental highlights | ||
| EURUSD: technical overview | ||
| The Euro outlook remains constructive with higher lows sought out on dips in favor of the next major upside extension targeting the 2021 high at 1.2350. Setbacks should be exceptionally well supported ahead of 1.1300. | ||
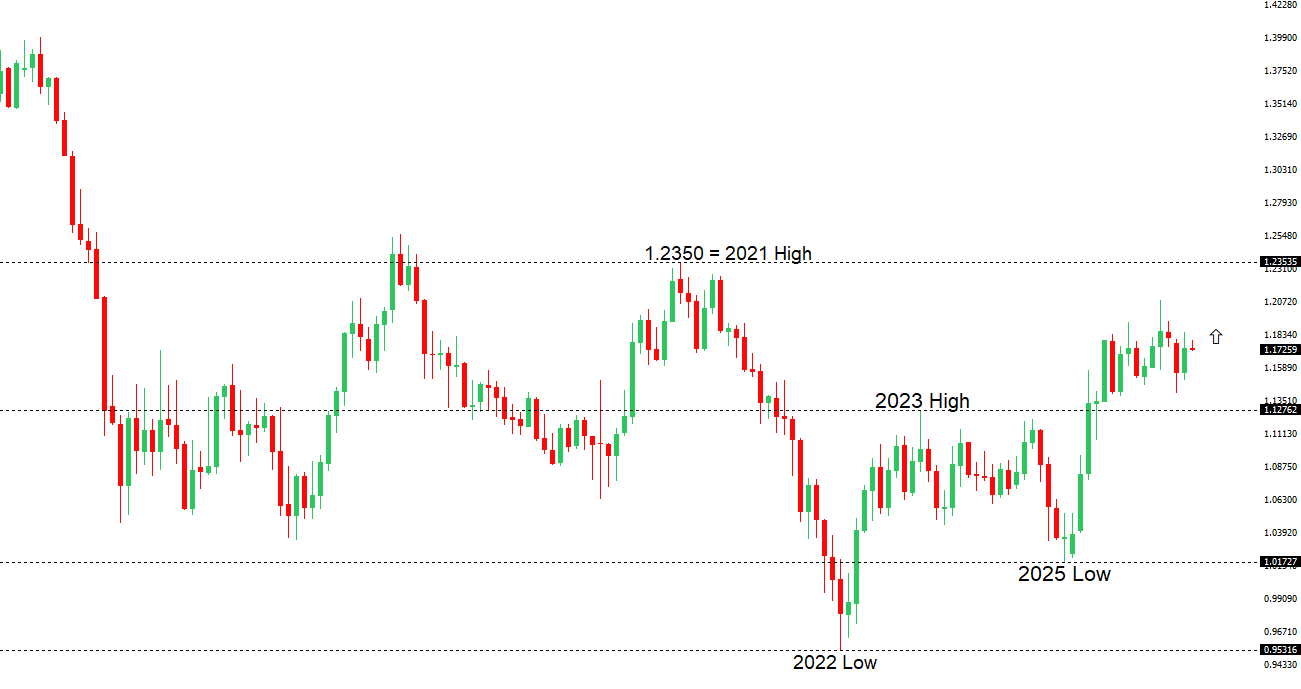 | ||
| R2 1.1850 - 17 April high - Strong R1 1.1797 - 6 May high - Medium S1 1.1650 - 9 April low - Medium S2 1.1589 - 8 April low - Strong | ||
| EURUSD: fundamental overview | ||
| The Euro is trading with a modestly constructive but ultimately range-bound bias, with price action being driven largely by external dynamics rather than a strong shift in Eurozone fundamentals. On the one hand, periodic optimism around a potential US-Iran de-escalation has weighed on the US Dollar and allowed EURUSD to hold above the 1.17 handle. However, this upside remains capped by lingering geopolitical uncertainty, with renewed tensions around the Strait of Hormuz sustaining a degree of safe-haven demand for the Dollar. At the same time, markets are reluctant to take strong directional views ahead of key US data, particularly the upcoming non-farm payrolls report, which is seen as critical in shaping expectations for the Federal Reserve policy path. From a European perspective, the European Central Bank continues to maintain a cautiously hawkish stance amid still-elevated inflation, but this is being offset by a fragile growth outlook and ongoing trade-related uncertainty. As a result, the Euro is effectively being pulled between a softer Dollar environment and persistent external risks, leaving it supported at current levels but lacking the conviction for a sustained breakout. | ||
| USDJPY: technical overview | ||
| There are signs of the formation of a meaningful top after the market put in a multi-year high in 2024. At this point, rallies should be well capped above 160.00 in favor of a fresh down-leg back towards the 2024 low at 139.58. Only a monthly close above 160.00 negates. | ||
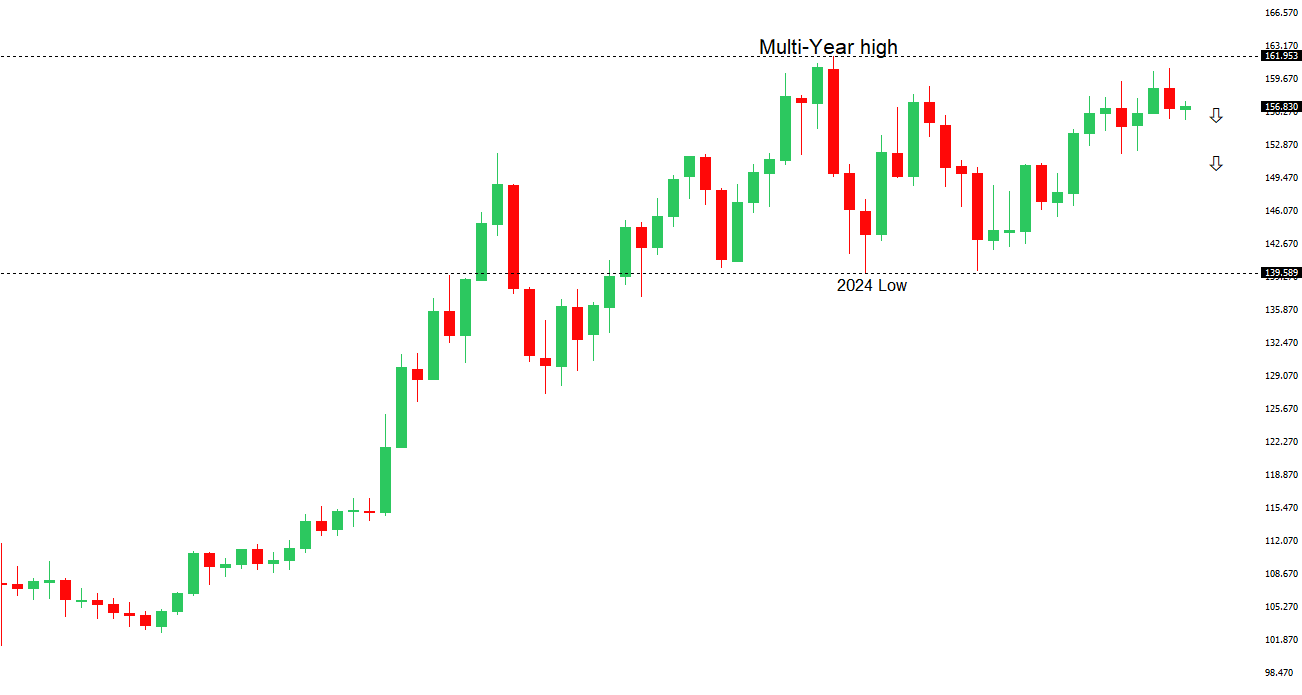 | ||
| R2 159.53 - 17 April low - Medium R1 157.93 - 6 May high - Medium S1 156.00 - Figure - Medium S2 155.02 - 6 May low - Strong | ||
| USDJPY: fundamental overview | ||
| The Yen is being driven by a complex interplay between aggressive policy intervention and shifting external dynamics, with recent price action reflecting both forces in real time. On one hand, authorities have stepped in repeatedly and at significant scale—reportedly deploying tens of billions of dollars in recent sessions—to defend the currency and counter disorderly moves, reinforcing a near-term floor under the Yen and pushing USDJPY sharply lower from its recent highs. Bank of Japan-linked intervention risk remains a key constraint on further Yen weakness, particularly with officials signaling a willingness to act again if needed. On the other hand, the broader macro backdrop is evolving, with easing tensions around the Strait of Hormuz driving oil prices lower, improving Japan’s terms of trade and offering additional support to the currency. However, underlying structural pressures remain in place, including wide yield differentials versus the Federal Reserve and the Yen’s entrenched role as a funding currency, which continue to limit follow-through on rallies. As a result, the Yen is benefiting from a combination of intervention, softer oil, and reduced geopolitical risk, but remains fundamentally fragile, with direction increasingly sensitive to incoming US data—particularly the upcoming non-farm payrolls report—and any renewed shifts in the global macro environment. | ||
| AUDUSD: technical overview | ||
| There are signs of the formation of a longer-term base with the market recovering out from a meaningful longer-term support zone. The latest monthly close back above 0.7000 takes the big picture pressure off the downside and strengthens the case for a bottom, with the focus now on a push towards 0.8000. Setbacks should now be well supported ahead of 0.6700. | ||
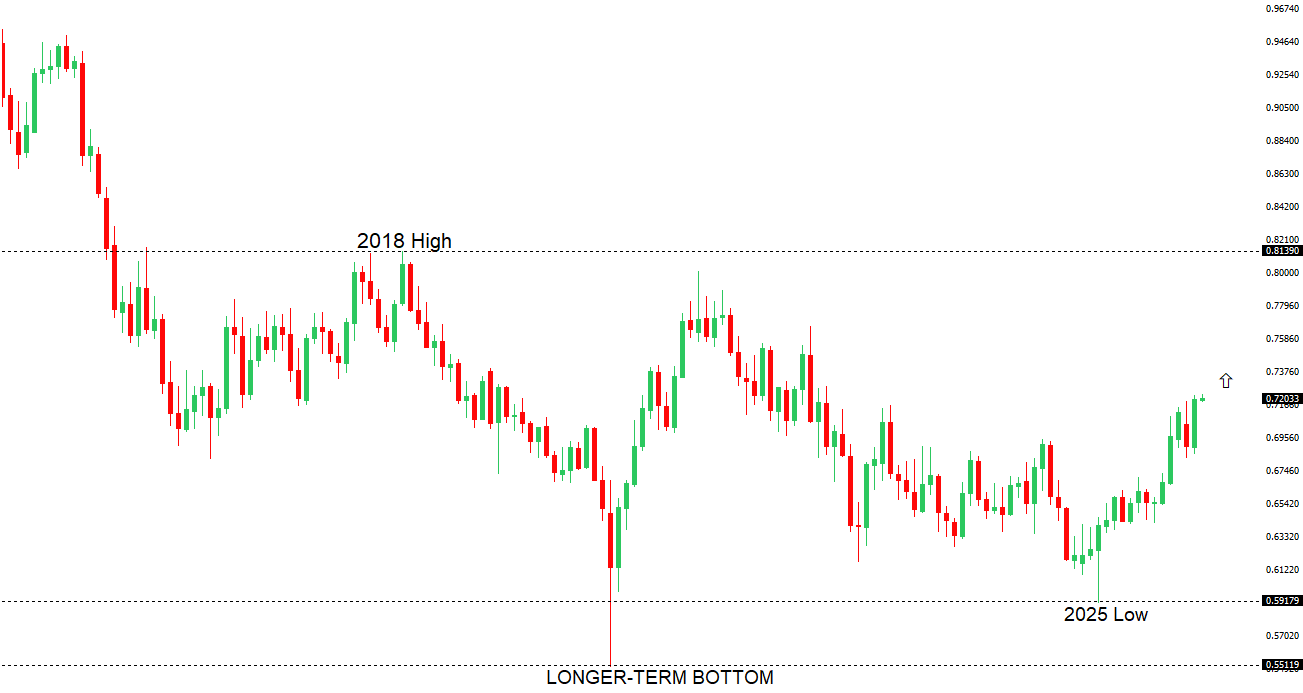 | ||
| R2 0.7300 - Figure - Medium R1 0.7278 - 6 May/2026 high - Medium S1 0.7101 - 30 April low - Medium S2 0.6963 - 8 April low - Strong | ||
| AUDUSD: fundamental overview | ||
| The Australian Dollar has pulled back from multi-year highs, with the near-term move driven by a combination of a modest US Dollar rebound and softer domestic fundamentals tempering what had been a strong risk-led rally. While the broader backdrop remains supportive—underpinned by improved global sentiment, easing Middle East tensions, and still-elevated yields following the recent 25bp hike from the Reserve Bank of Australia to 4.35%—the currency is facing some loss of momentum. The RBA’s shift toward a more patient stance, emphasizing that policy is now restrictive and allowing time to assess the inflation impact of the energy shock, has limited further upside from rate expectations. At the same time, weaker domestic data—most notably the surprise shift in Australia’s trade balance into deficit, driven by falling exports—has raised questions about external demand and added a local headwind. Externally, the AUD continues to trade as a proxy for global risk and US Dollar direction, with the recent pullback in oil and some fading of peak optimism around a US-Iran deal prompting a partial unwind of risk positioning. As a result, while the medium-term outlook remains constructive, the Aussie is showing signs of consolidation near highs, with upside increasingly dependent on renewed USD weakness and sustained improvement in global conditions. | ||
| Suggested reading | ||
| Storm Clouds Over The European Economy, D. Lachman, AEI-Ideas (May 4, 2026) The Inflation Diversification Problem, E. Cole, Man Group (May 1, 2026) | ||