


 | ||
| 7th May 2026 | view in browser | ||
| From tension to traction | ||
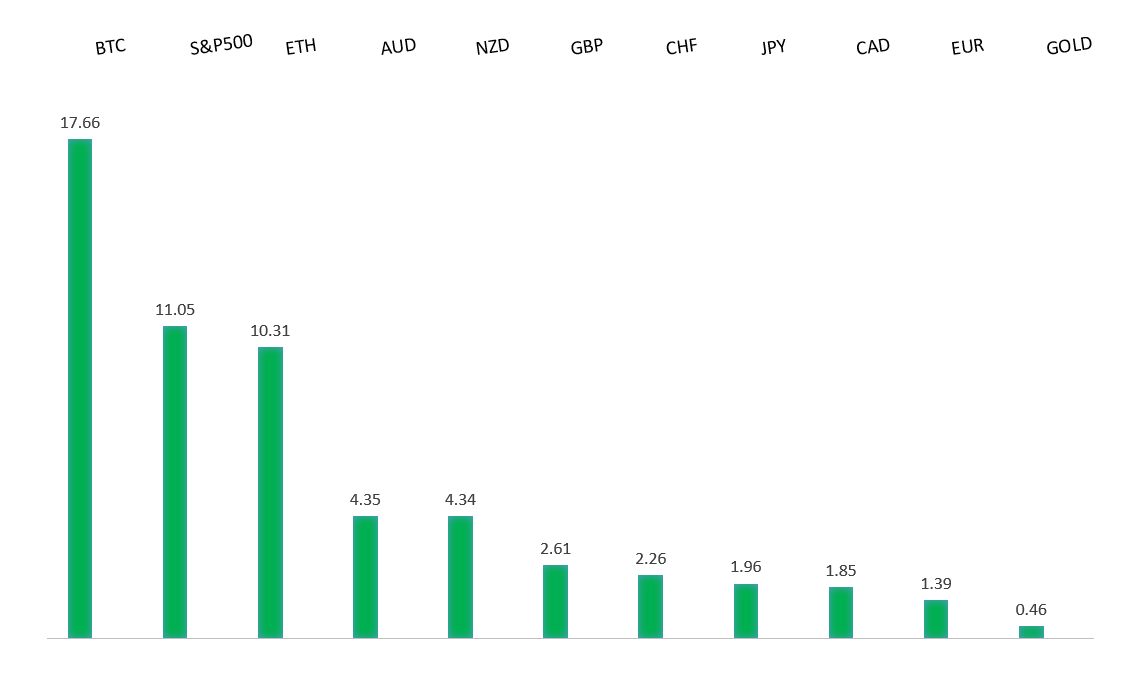
| Markets are firmly in risk-on mode, with the Dollar weakening and equities near highs as easing Middle East tensions and falling oil prices reduce inflation fears ahead of key US labor data. | ||
| Performance chart 30day v. USD (%) | ||
 | ||
| Technical & fundamental highlights | ||
| EURUSD: technical overview | ||
| The Euro outlook remains constructive with higher lows sought out on dips in favor of the next major upside extension targeting the 2021 high at 1.2350. Setbacks should be exceptionally well supported ahead of 1.1300. | ||
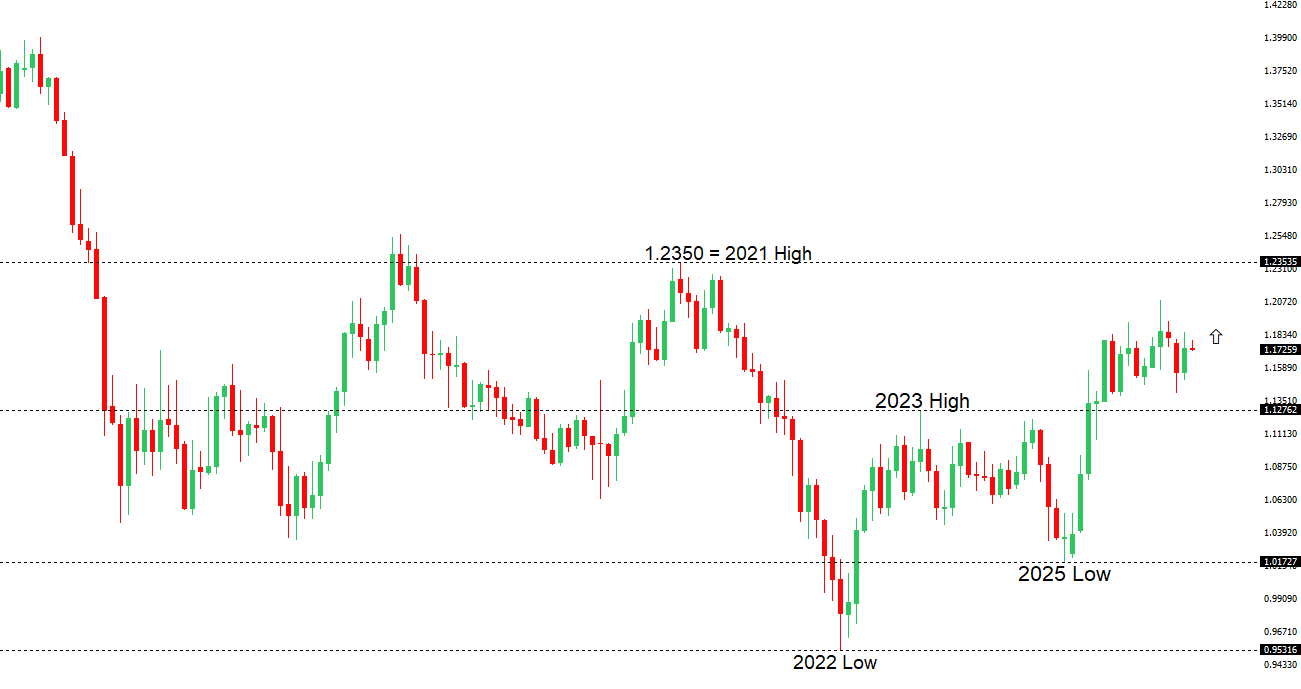 | ||
| R2 1.1850 - 17 April high - Strong R1 1.1797 - 6 May high - Medium S1 1.1650 - 9 April low - Medium S2 1.1589 - 8 April low - Strong | ||
| EURUSD: fundamental overview | ||
| The Euro is being supported primarily by external dynamics, with EURUSD holding firm as a softer US Dollar remains the dominant driver. The key catalyst has been growing optimism around a potential US-Iran agreement, which is easing geopolitical risk, pushing oil prices lower, and reducing safe-haven demand for the greenback. This has also contributed to a modest repricing of expectations around the Federal Reserve, with fading hawkishness at the margin weighing further on the Dollar. Against this backdrop, the European Central Bank continues to offer a degree of underlying support, maintaining a cautious tightening bias amid still-elevated inflation, though this is not the primary driver of recent price action. Instead, the Euro is largely trading as a function of USD weakness and broader risk sentiment, with lingering uncertainty around the durability of any Iran deal and still-present expectations for higher US rates limiting more aggressive upside. As a result, while the near-term bias remains constructive, the move is externally driven and remains sensitive to shifts in geopolitics and incoming US data, particularly ahead of tomorrow’s key payrolls release. | ||
| USDJPY: technical overview | ||
| There are signs of the formation of a meaningful top after the market put in a multi-year high in 2024. At this point, rallies should be well capped above 160.00 in favor of a fresh down-leg back towards the 2024 low at 139.58. Only a monthly close above 160.00 negates. | ||
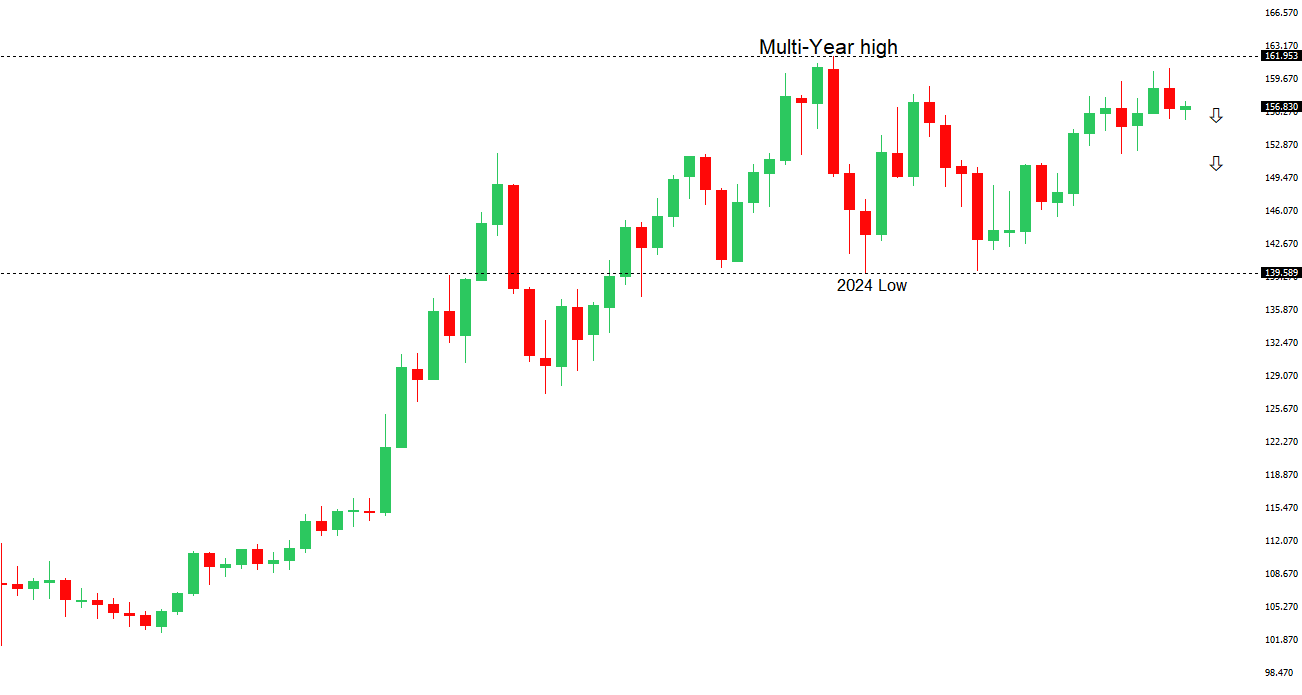 | ||
| R2 159.53 - 17 April low - Medium R1 157.93 - 6 May high - Medium S1 156.00 - Figure - Medium S2 155.02 - 6 May low - Strong | ||
| USDJPY: fundamental overview | ||
| The Yen is currently trading in a more balanced consolidation phase, supported by a combination of policy and intervention dynamics even as broader structural headwinds remain in place. On the supportive side, the Bank of Japan is maintaining a relatively hawkish tilt, with recent guidance and meeting minutes reinforcing that further rate hikes remain on the table if inflation and wage dynamics evolve as expected, marking a gradual shift away from ultra-accommodative policy. At the same time, persistent intervention risk—underscored by both verbal warnings from officials and evidence of large-scale FX operations—continues to act as a deterrent to aggressive Yen selling, effectively placing a ceiling on USDJPY rallies. This is being complemented by a softer US Dollar backdrop, as easing geopolitical tensions and falling oil prices reduce inflation pressures and dampen expectations for further tightening from the Federal Reserve. However, the broader picture remains nuanced: the Yen is still constrained by lingering yield differentials and its role as a funding currency, meaning gains are more episodic than sustained. As a result, the currency is being pulled between near-term support from intervention and shifting policy expectations, and longer-term pressure from structural carry dynamics, leaving USDJPY range-bound as markets await clearer direction on both central bank policy and the geopolitical outlook. | ||
| AUDUSD: technical overview | ||
| There are signs of the formation of a longer-term base with the market recovering out from a meaningful longer-term support zone. The latest monthly close back above 0.7000 takes the big picture pressure off the downside and strengthens the case for a bottom, with the focus now on a push towards 0.8000. Setbacks should now be well supported ahead of 0.6700. | ||
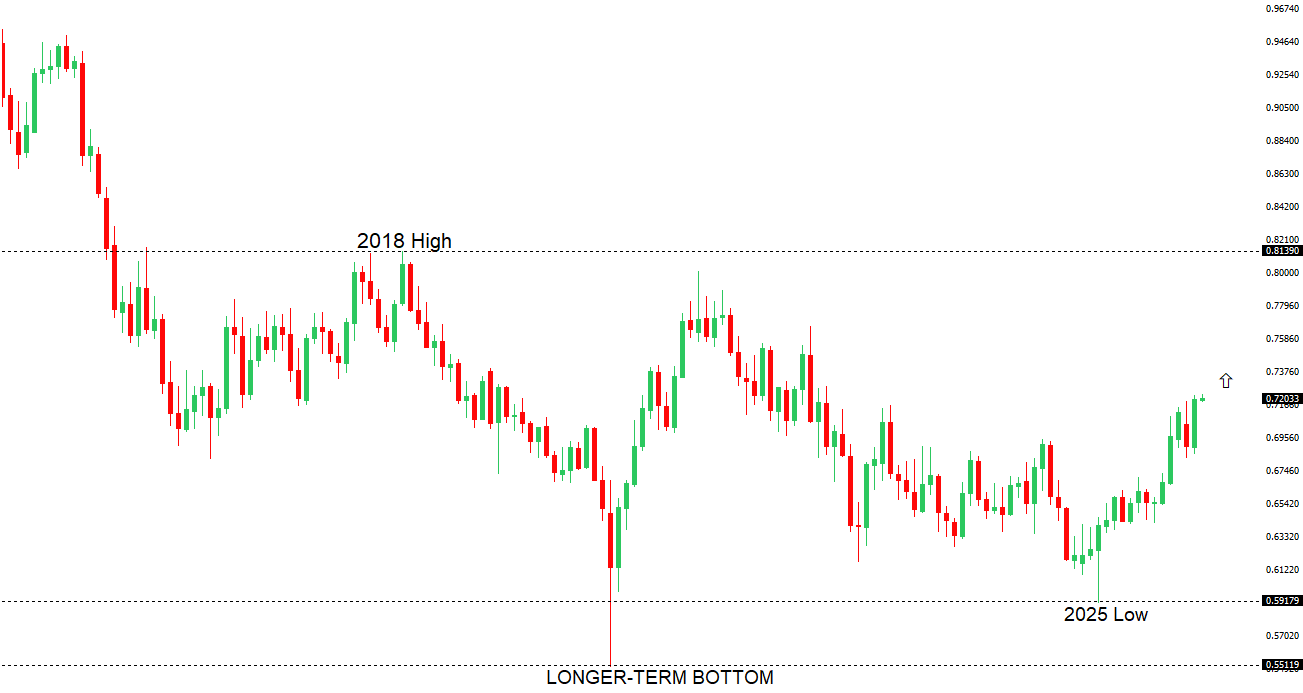 | ||
| R2 0.7300 - Figure - Medium R1 0.7278 - 6 May/2026 high - Medium S1 0.7101 - 30 April low - Medium S2 0.6963 - 8 April low - Strong | ||
| AUDUSD: fundamental overview | ||
| The Australian Dollar remains supported but is increasingly transitioning into a more nuanced, consolidation phase, with price action driven primarily by external factors rather than a strong domestic impulse. On the one hand, improving global risk sentiment—helped by easing tensions in the Middle East and a sharp pullback in oil prices—is weighing on the US Dollar and underpinning AUDUSD near multi-year highs. At the same time, the Reserve Bank of Australia continues to provide a structural floor, having lifted rates to restrictive levels while maintaining a cautious stance amid still-sticky inflation and the risk of second-round effects. However, this support is being tempered by a clear shift in policy tone toward patience, with policymakers signaling they are now comfortable pausing to assess the outlook. Domestically, the picture is mixed: growth remains relatively resilient and inflation elevated, but there are signs of cooling in the labor market and uneven activity data, including softer trade dynamics. China is acting more as a stabilizer than a tailwind, while the broader rally remains heavily dependent on USD direction and risk appetite. As a result, the Aussie is holding a constructive bias, but conviction is still lacking, leaving it vulnerable to shifts in sentiment despite the underlying yield support. | ||
| Suggested reading | ||
| Gold-Timing Signal That Has Historically Signaled Rally, M. Hulbert, Marketwatch (May 6, 2026) Will Bending The Rules Break The Market?, J. Zweig, The Intelligent Investor (May 5, 2026) | ||