


 | ||
| 29th May 2026 | view in browser | ||
| Markets price peace but hedge the headline risk | ||
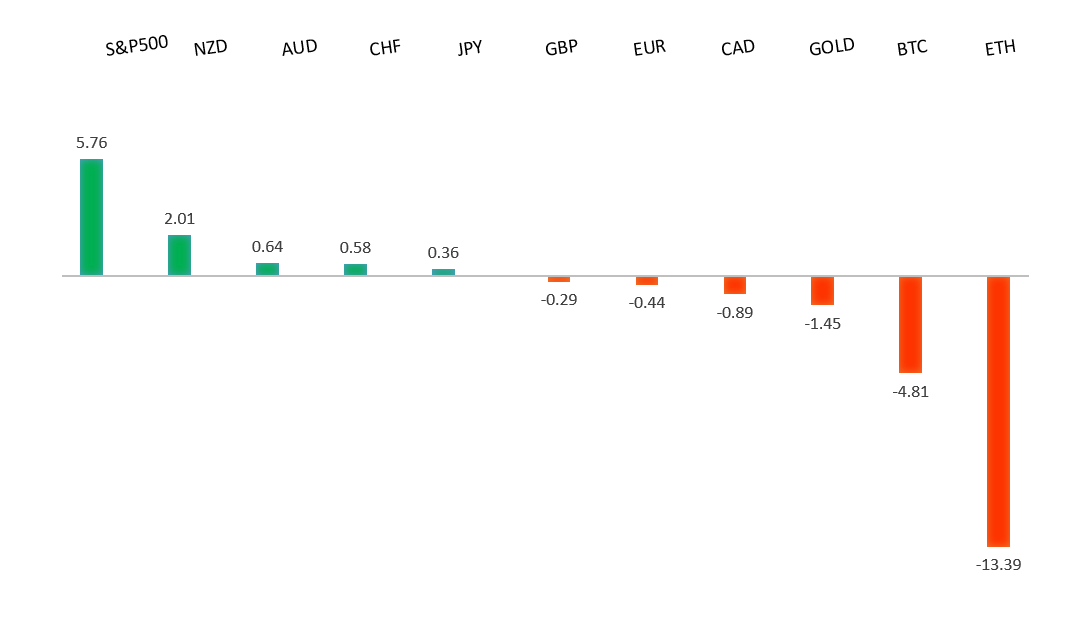
| Markets remain broadly risk-positive on softer U.S. inflation and AI-led equity strength, but investors are staying cautious as unresolved U.S.-Iran negotiations, BOJ policy uncertainty, and geopolitical tensions continue to shape FX, commodities, and broader macro price action. | ||
| Performance chart 30day v. USD (%) | ||
 | ||
| Technical & fundamental highlights | ||
| EURUSD: technical overview | ||
| The Euro outlook remains constructive with higher lows sought out on dips in favor of the next major upside extension targeting the 2021 high at 1.2350. Setbacks should be exceptionally well supported ahead of 1.1300. | ||
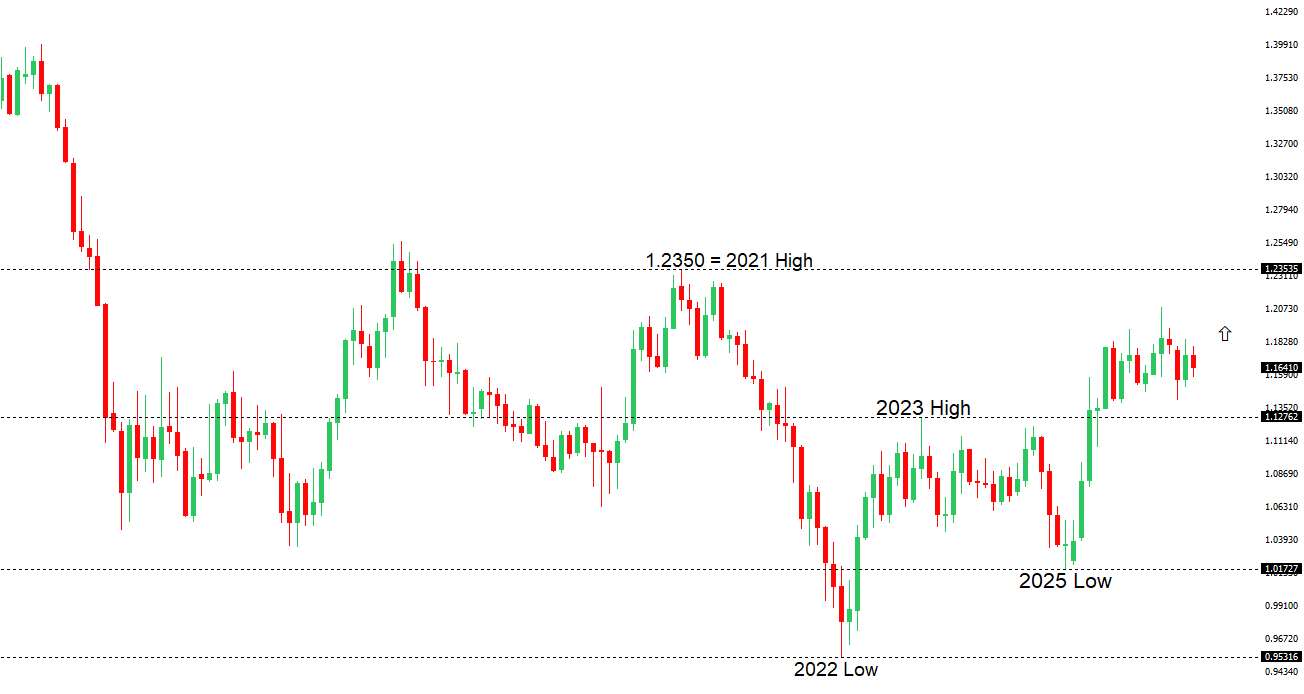 | ||
| R2 1.1797 - 6 May high - Medium R1 1.1722 - 14 May high - Medium S1 1.1576 - 21 May low - Medium S2 1.1504 - 3 April low - Strong | ||
| EURUSD: fundamental overview | ||
| The euro remains well supported on a combination of improving risk sentiment, relative growth resilience, and a less negative rates outlook. Most recently, reports of progress toward a US-Iran agreement and an extension of the ceasefire have helped underpin broader risk appetite, encouraging demand for pro-cyclical currencies including the euro. At the same time, softer-than-expected monthly US core PCE inflation and signs of moderating US growth have reinforced expectations that the Federal Reserve will be able to adopt a less restrictive policy stance going forward, weighing on the US dollar. On the euro side, investors continue to draw support from expectations that the ECB is nearing the end of its easing cycle, while Germany’s fiscal expansion plans and increased European defense and infrastructure spending are seen as constructive for the medium-term growth outlook. The result has been a continuation of the favorable EURUSD dynamic, with dips attracting demand amid a still-broad trend of dollar weakness. | ||
| USDJPY: technical overview | ||
| There are signs of the formation of a meaningful top after the market put in a multi-year high in 2024. At this point, rallies should be well capped above 160.00 in favor of a fresh down-leg back towards the 2024 low at 139.58. Only a monthly close above 160.00 negates. | ||
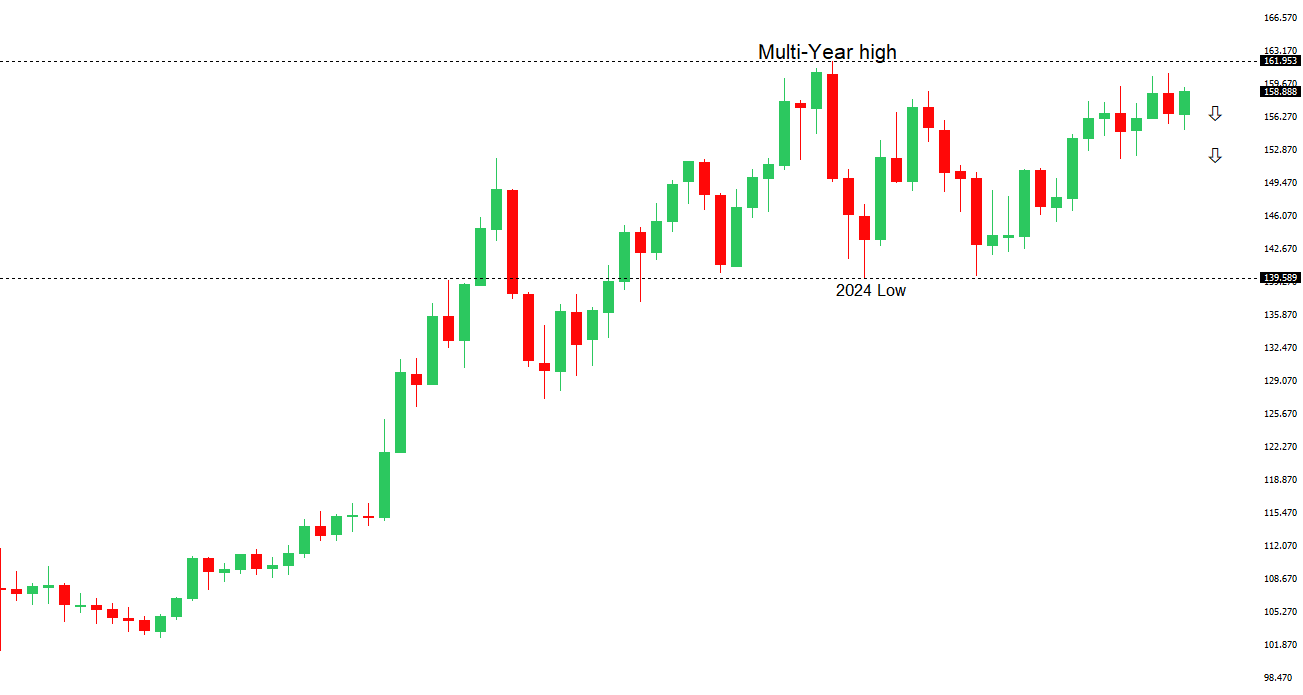 | ||
| R2 160.00 - Psychological - Strong R1 159.66 - 28 May high - Medium S1 158.59 - 20 May low - Medium S2 157.29 - 14 May low - Medium | ||
| USDJPY: fundamental overview | ||
| Japan fundamentals remain mixed for the yen. On one hand, BoJ Governor Ueda’s recent remarks reinforced expectations that the central bank remains concerned about inflation becoming embedded through wages and inflation expectations, keeping the prospect of further policy normalization alive. However, the latest Tokyo CPI report complicated that narrative, with headline, core, and core-core inflation all slowing more than expected in May, reducing the urgency for a June rate hike and prompting some investors to push expectations toward a later move despite markets still assigning a relatively high probability of tightening in the months ahead. At the same time, stronger-than-expected April retail sales and industrial production data suggest domestic demand and manufacturing activity remain resilient, helping to offset concerns about the broader economy. The dominant driver of yen weakness continues to be the wide US-Japan rate differential, with US yields remaining elevated relative to JGB yields, while Japan’s dependence on imported energy leaves the economy vulnerable to higher oil prices and a weaker currency. Against this backdrop, intervention risks have become an increasingly important support factor, with USDJPY once again approaching the psychologically important ¥160 level. Market participants are awaiting official Ministry of Finance intervention data, with estimates suggesting authorities may have spent as much as ¥10 trillion defending the currency in late April and early May. While intervention fears may slow the pace of depreciation, investors generally view direct FX operations as a temporary tool rather than a lasting solution unless accompanied by a meaningful narrowing in US-Japan yield differentials through further BoJ tightening. | ||
| AUDUSD: technical overview | ||
| There are signs of the formation of a longer-term base with the market recovering out from a meaningful longer-term support zone. The latest monthly close back above 0.7000 takes the big picture pressure off the downside and strengthens the case for a bottom, with the focus now on a push towards 0.8000. Setbacks should now be well supported ahead of 0.6700. | ||
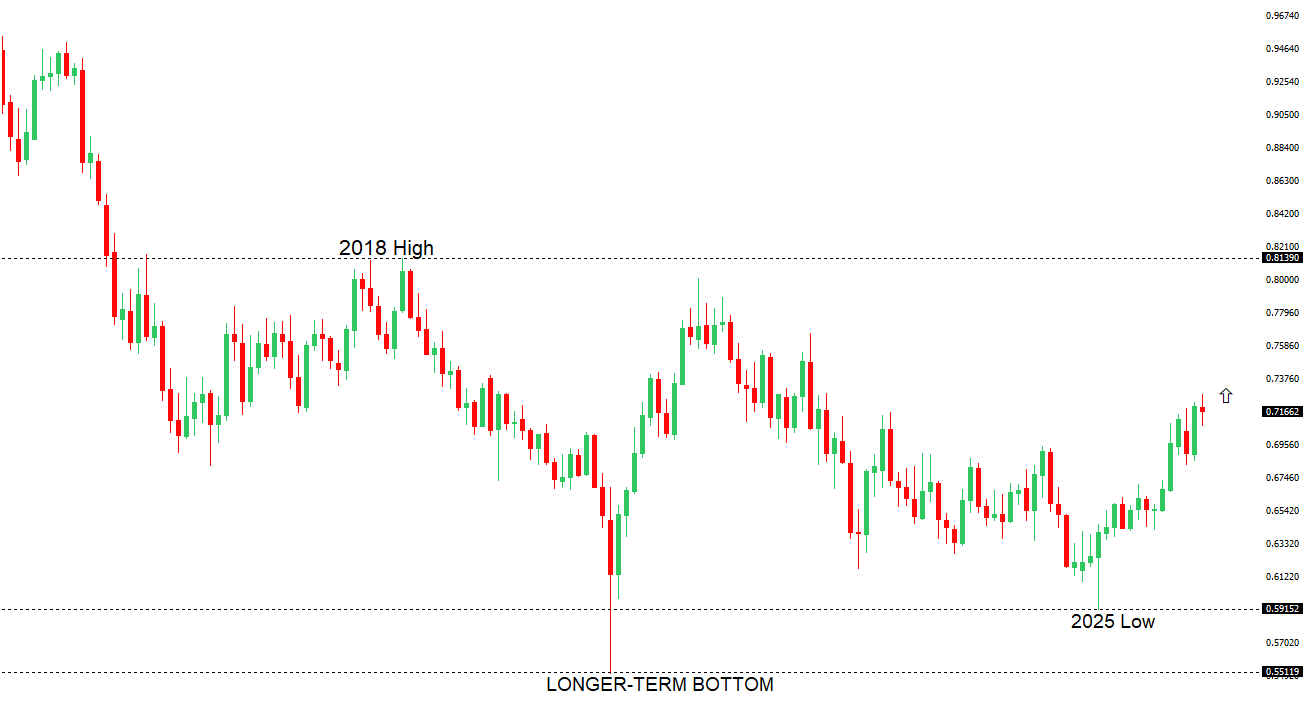 | ||
| R2 0.7278 - 6 May/2026 high - Strong R1 0.7222 - 17 April high - Medium S1 0.7079 - 19 May low - Medium S2 0.6963 - 8 April low - Strong | ||
| AUDUSD: fundamental overview | ||
| The Australian dollar has been trading with a mixed fundamental backdrop, caught between shifting global risk sentiment and a material repricing of RBA expectations. Recent Australian inflation data surprised to the downside, with both monthly and annual CPI readings cooling faster than anticipated, prompting markets to sharply scale back expectations for additional RBA tightening. Following the data, the probability of a near-term rate hike was largely priced out, while expectations for further policy tightening later in the year were significantly reduced, undermining a key source of support for the currency. At the same time, escalating geopolitical tensions in the Middle East have weighed on broader risk appetite, typically a headwind for the risk-sensitive Australian dollar. However, intermittent bouts of US dollar weakness, driven by hopes of de-escalation in the region and evolving expectations around the US policy outlook, have helped cushion downside pressure. As a result, AUDUSD remains range-bound, with softer domestic inflation and a less hawkish RBA offsetting support from periods of improved global sentiment and US dollar consolidation. | ||
| Suggested reading | ||
| AI Can’t Pick Winning Funds. But It Can Avoid Bad Ones, L. Swedroe, Morningstar (May 28, 2026) China’s Long March to Technological Supremacy, J. Rockstrom, Project Syndicate (May 27, 2026) | ||