


 | ||
| 28th May 2026 | view in browser | ||
| Dollar up, gold down, nerves fraying | ||
| Markets remain dominated by the inflationary fallout from escalating US-Iran tensions, with higher oil prices and hawkish central bank rhetoric driving dollar strength, pressuring equities and gold, and reinforcing the higher-for-longer global rates narrative. | ||
| Performance chart 30day v. USD (%) | ||
 | ||
| Technical & fundamental highlights | ||
| EURUSD: technical overview | ||
| The Euro outlook remains constructive with higher lows sought out on dips in favor of the next major upside extension targeting the 2021 high at 1.2350. Setbacks should be exceptionally well supported ahead of 1.1300. | ||
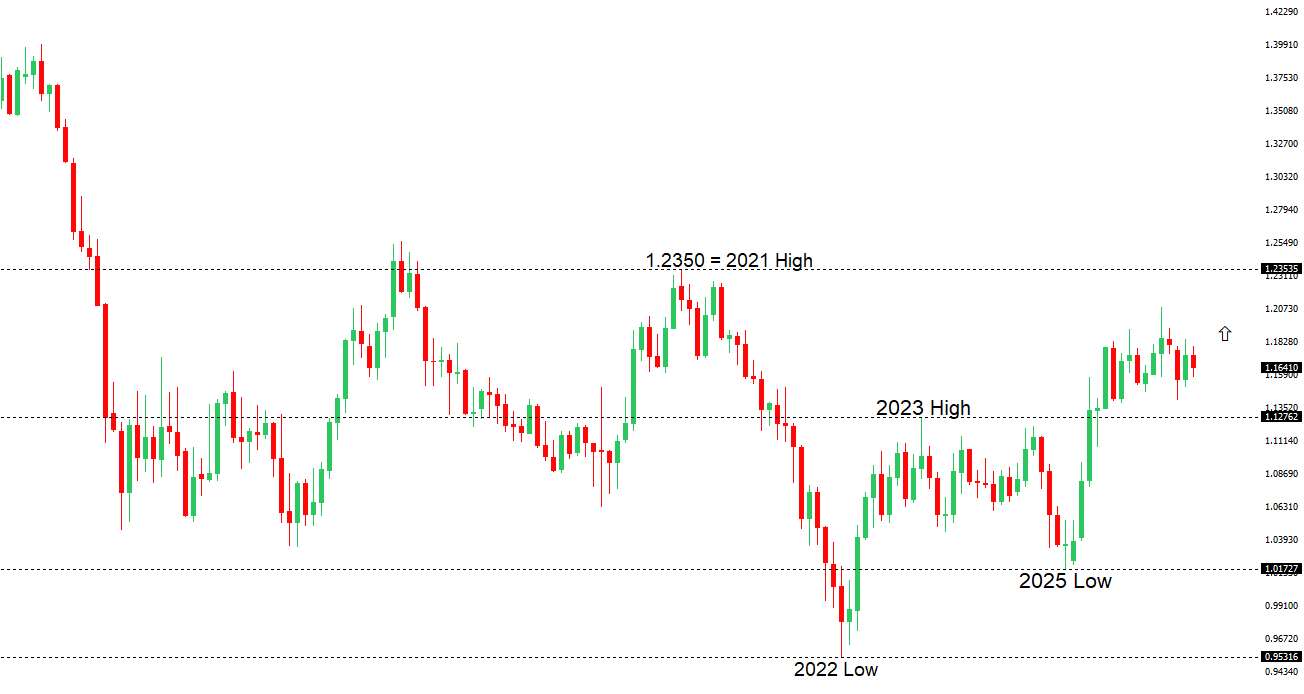 | ||
| R2 1.1797 - 6 May high - Medium R1 1.1722 - 14 May high - Medium S1 1.1576 - 21 May low - Medium S2 1.1504 - 3 April low - Strong | ||
| EURUSD: fundamental overview | ||
| The Euro has come under renewed pressure amid a broader flight to safety after Iran retaliated against recent US strikes, with reports of attacks on US military bases and explosions near Bandar Abbas fueling concerns of a wider regional conflict and supporting demand for the US Dollar. The deterioration in risk sentiment has overshadowed what had otherwise been a constructive backdrop for the single currency, including improving Eurozone growth expectations and optimism around increased fiscal spending in Germany. At the same time, markets remain cautious ahead of key US PCE inflation data and Germany’s preliminary May HICP release, both of which could shape expectations for the Fed and ECB policy outlooks. ECB officials have continued to signal confidence that inflation is moving sustainably back toward target, reinforcing expectations the central bank is nearing the end of its easing cycle, though geopolitical tensions and softer global risk appetite are limiting Euro upside for now. | ||
| USDJPY: technical overview | ||
| There are signs of the formation of a meaningful top after the market put in a multi-year high in 2024. At this point, rallies should be well capped above 160.00 in favor of a fresh down-leg back towards the 2024 low at 139.58. Only a monthly close above 160.00 negates. | ||
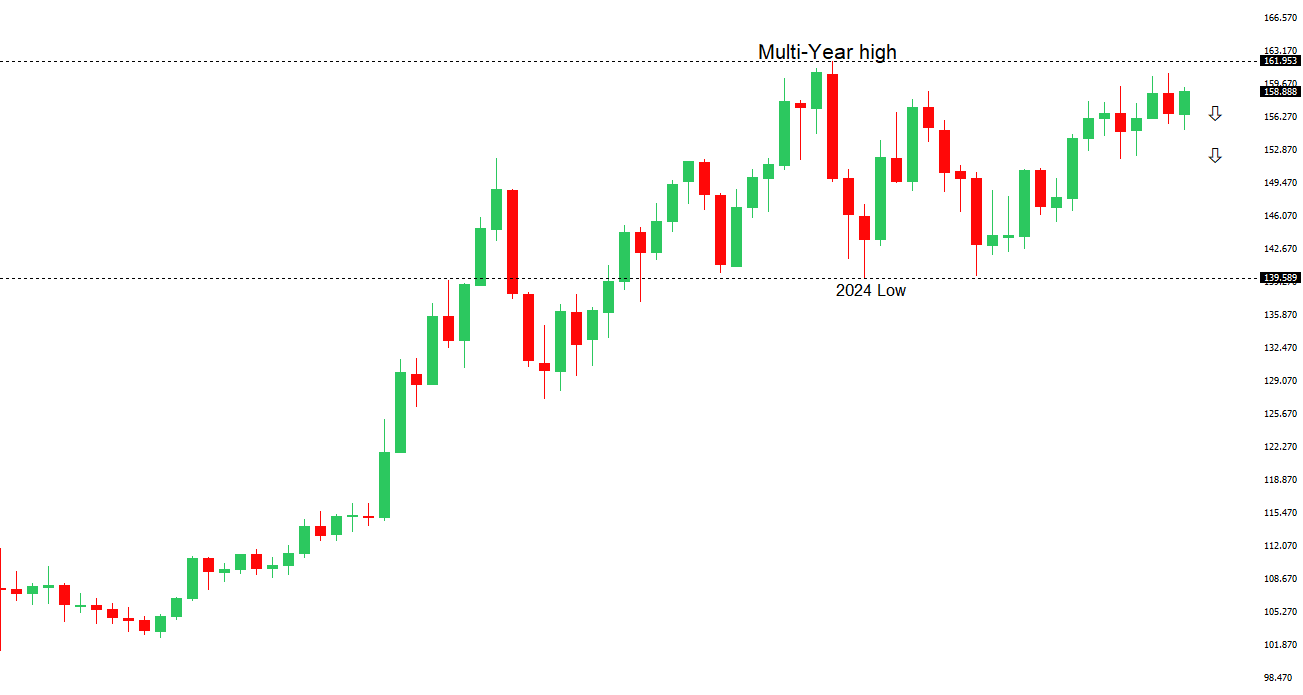 | ||
| R2 160.00 - Psychological - Strong R1 159.66 - 28 May high - Medium S1 158.59 - 20 May low - Medium S2 157.29 - 14 May low - Medium | ||
| USDJPY: fundamental overview | ||
| The Yen has remained caught between increasingly hawkish Bank of Japan expectations and still-powerful external headwinds. BoJ Governor Kazuo Ueda’s latest comments reinforced the view that policymakers are becoming more concerned that higher energy prices could feed into wages, inflation expectations, and broader price-setting behavior, keeping alive expectations for additional policy normalization in the months ahead. Recent inflation readings have continued to hold above the BoJ’s 2% target, while steady wage growth has strengthened the case for further rate hikes. However, Yen gains have been limited by Japan’s vulnerability to elevated oil prices, rising concerns about the domestic growth outlook, and persistently wide yield differentials with the United States, where Treasury yields remain comparatively attractive. On the external side, the Dollar has continued to draw support from resilient US economic data and a more hawkish repricing of Federal Reserve expectations, with markets scaling back the scope for easing amid sticky inflation and firm labor market conditions. Investors are now closely focused on upcoming Tokyo CPI data and US PCE inflation figures for further confirmation on the policy outlook for both the BoJ and the Fed, while rising geopolitical tensions and higher crude prices are also contributing to volatility. | ||
| AUDUSD: technical overview | ||
| There are signs of the formation of a longer-term base with the market recovering out from a meaningful longer-term support zone. The latest monthly close back above 0.7000 takes the big picture pressure off the downside and strengthens the case for a bottom, with the focus now on a push towards 0.8000. Setbacks should now be well supported ahead of 0.6700. | ||
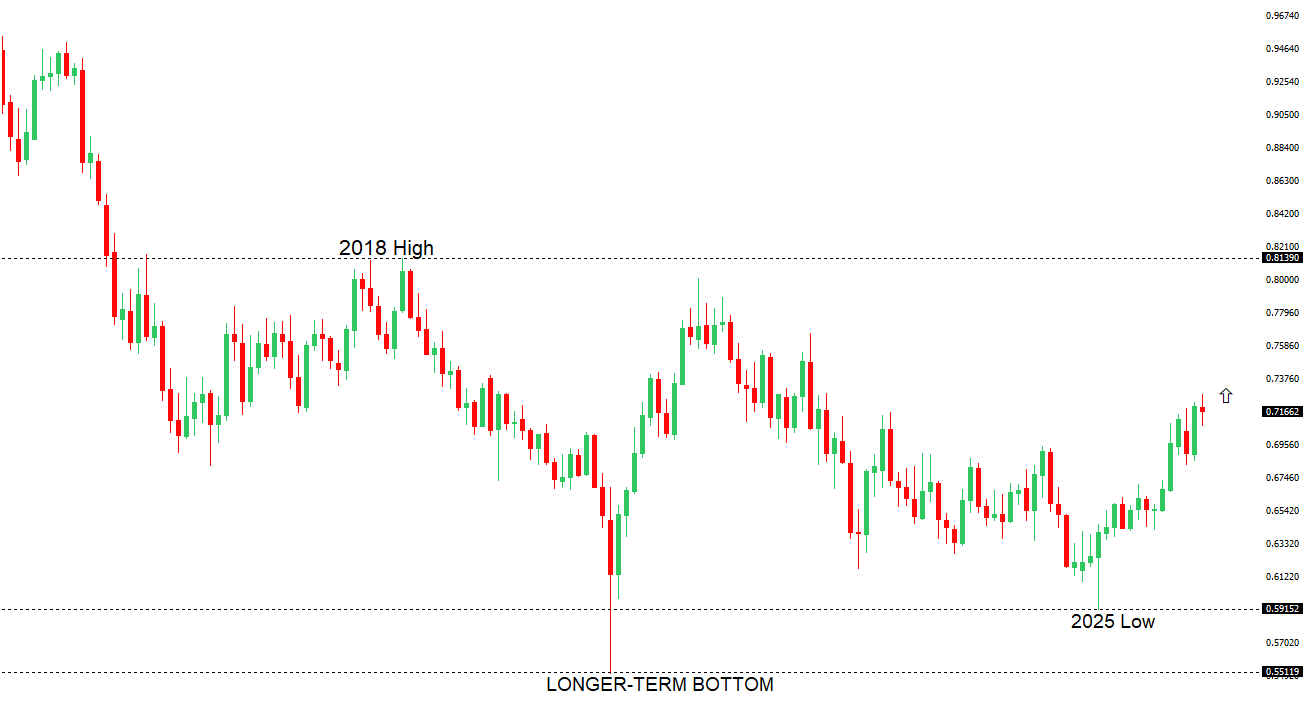 | ||
| R2 0.7278 - 6 May/2026 high - Strong R1 0.7222 - 17 April high - Medium S1 0.7079 - 19 May low - Medium S2 0.6963 - 8 April low - Strong | ||
| AUDUSD: fundamental overview | ||
| The Australian dollar has come under renewed pressure as softer domestic data has prompted markets to scale back expectations for additional RBA tightening, particularly following weaker labor market readings and a moderation in headline inflation. While underlying price pressures remain sticky, investors increasingly believe the RBA may be nearing the end of its hiking cycle as slowing growth and easing demand begin to weigh on the economy. At the same time, heightened geopolitical tensions in the Middle East and the resulting surge in energy prices have fueled broader risk aversion and supported the US dollar and Japanese yen at the expense of higher-beta currencies like the Aussie. Concerns over slower Chinese growth – a key driver for Australia’s commodity-linked economy – have also limited AUD upside, despite some support from resilient metals demand and relatively elevated Australian yields. Meanwhile, hawkish Bank of Japan rhetoric and lingering fears of Japanese FX intervention have added further downside pressure. | ||
| Suggested reading | ||
| Why Double Digit Earnings Growth Won’t Stop the Bear, M. Hulbert, Marketwatch (May 27, 2026) If Expectations Aren’t Met, It’s Long Way Down, J. Calhoun, Alhambra (May 25, 2026) | ||