


 | ||
| 27th May 2026 | view in browser | ||
| AI euphoria and easing yields keep bulls in control | ||
| Markets are trading with a broadly constructive risk tone as easing bond yields, relentless AI-driven equity momentum, and optimism around a potential US-Iran diplomatic framework continue to outweigh geopolitical uncertainty and lingering inflation concerns. | ||
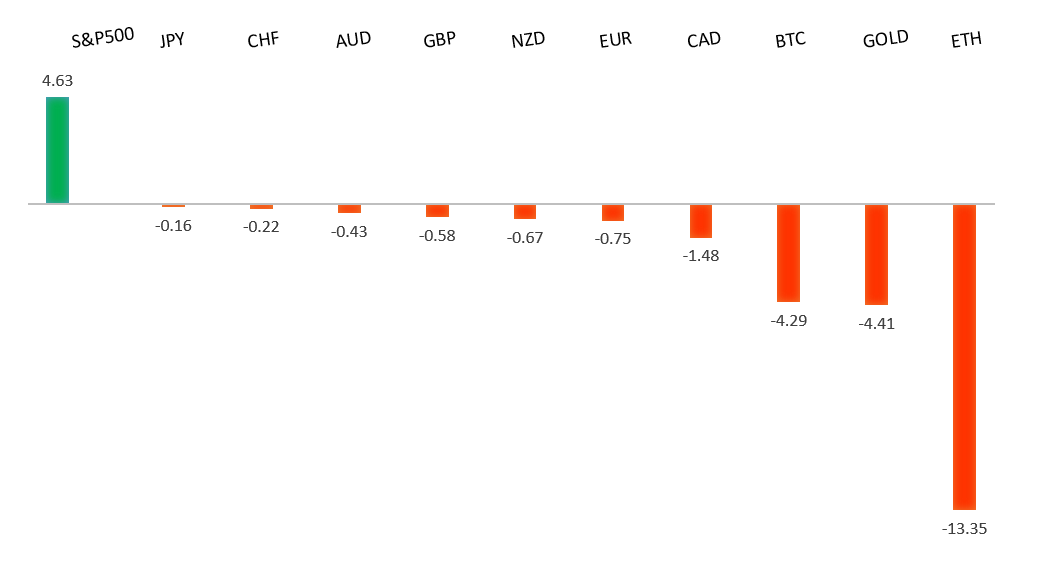
| Performance chart 30day v. USD (%) | ||
 | ||
| Technical & fundamental highlights | ||
| EURUSD: technical overview | ||
| The Euro outlook remains constructive with higher lows sought out on dips in favor of the next major upside extension targeting the 2021 high at 1.2350. Setbacks should be exceptionally well supported ahead of 1.1300. | ||
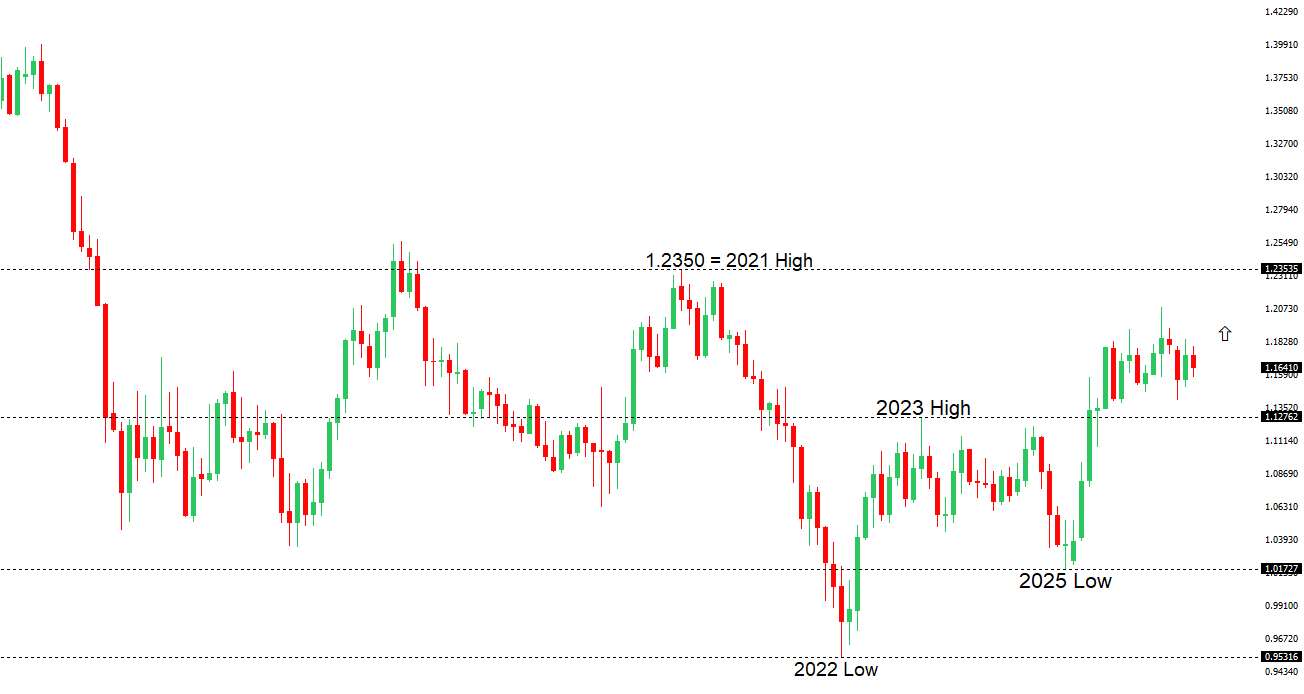 | ||
| R2 1.1797 - 6 May high - Medium R1 1.1722 - 14 May high - Medium S1 1.1576 - 21 May low - Medium S2 1.1504 - 3 April low - Strong | ||
| EURUSD: fundamental overview | ||
| The euro has remained well supported against the dollar, with EURUSD extending gains toward the mid-1.16s as a combination of improving global risk sentiment and a relatively hawkish ECB backdrop continues to underpin the single currency. Optimism surrounding a potential US-Iran agreement and reduced fears over disruption through the Strait of Hormuz have weighed on traditional safe-haven demand for the dollar, while broader market sentiment has improved amid easing geopolitical risk premiums. At the same time, ECB officials have continued to reinforce a comparatively firm inflation stance, with policymakers including Francois Villeroy de Galhau and Isabel Schnabel stressing the need to preserve the ECB’s inflation-fighting credibility and warning that energy-related second-round effects could keep price pressures elevated. Markets have subsequently scaled back expectations for aggressive ECB easing, helping support euro rate differentials. The move higher in EURUSD has also been aided by growing concerns over the US fiscal outlook and expectations that the Federal Reserve is moving closer to a more dovish policy pivot later this year as US growth momentum softens and inflation gradually moderates. | ||
| USDJPY: technical overview | ||
| There are signs of the formation of a meaningful top after the market put in a multi-year high in 2024. At this point, rallies should be well capped above 160.00 in favor of a fresh down-leg back towards the 2024 low at 139.58. Only a monthly close above 160.00 negates. | ||
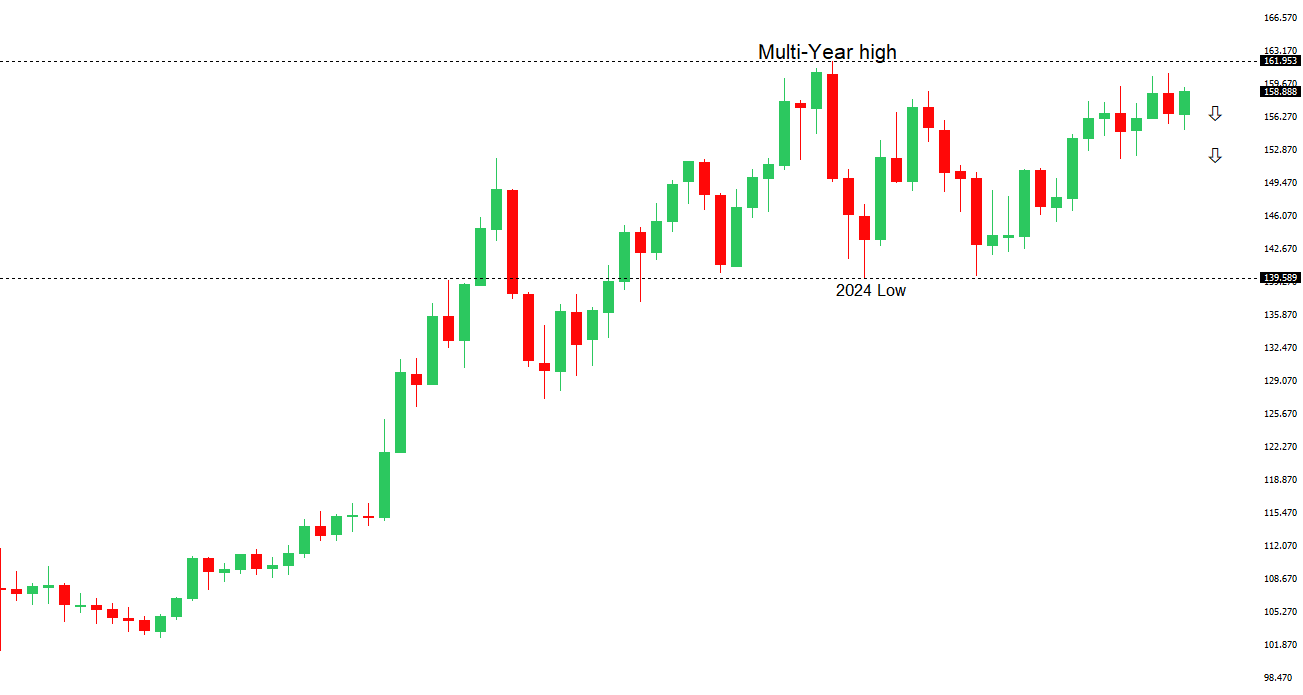 | ||
| R2 160.00 - Psychological - Strong R1 159.50 - Mid-Figure - Medium S1 158.59 - 20 May low - Medium S2 157.29 - 14 May low - Medium | ||
| USDJPY: fundamental overview | ||
| The Japanese Yen has been driven primarily by a combination of rising expectations for further Bank of Japan tightening, intervention fears, and ongoing geopolitical uncertainty tied to the Middle East. Recent hawkish remarks from BoJ Deputy Governor Ryozo Himino and Governor Kazuo Ueda reinforced the view that the BoJ remains on a gradual rate-hike path as policymakers grow increasingly concerned that higher energy prices could fuel broader inflation pressures in Japan. At the same time, traders remain cautious about pushing USDJPY materially above the 160 level amid speculation Japanese authorities could step in again to support the currency following suspected intervention earlier this month. However, the Yen’s upside continues to be capped by concerns that prolonged disruptions to Middle East energy supplies would disproportionately hurt Japan’s import-dependent economy and worsen the domestic growth outlook. Meanwhile, elevated US yields, lingering safe-haven demand for the Dollar amid the Iran conflict, and market expectations that the Federal Reserve will keep policy restrictive into 2026 have continued to underpin the USD and limit deeper downside in USDJPY despite the more hawkish BoJ backdrop. | ||
| AUDUSD: technical overview | ||
| There are signs of the formation of a longer-term base with the market recovering out from a meaningful longer-term support zone. The latest monthly close back above 0.7000 takes the big picture pressure off the downside and strengthens the case for a bottom, with the focus now on a push towards 0.8000. Setbacks should now be well supported ahead of 0.6700. | ||
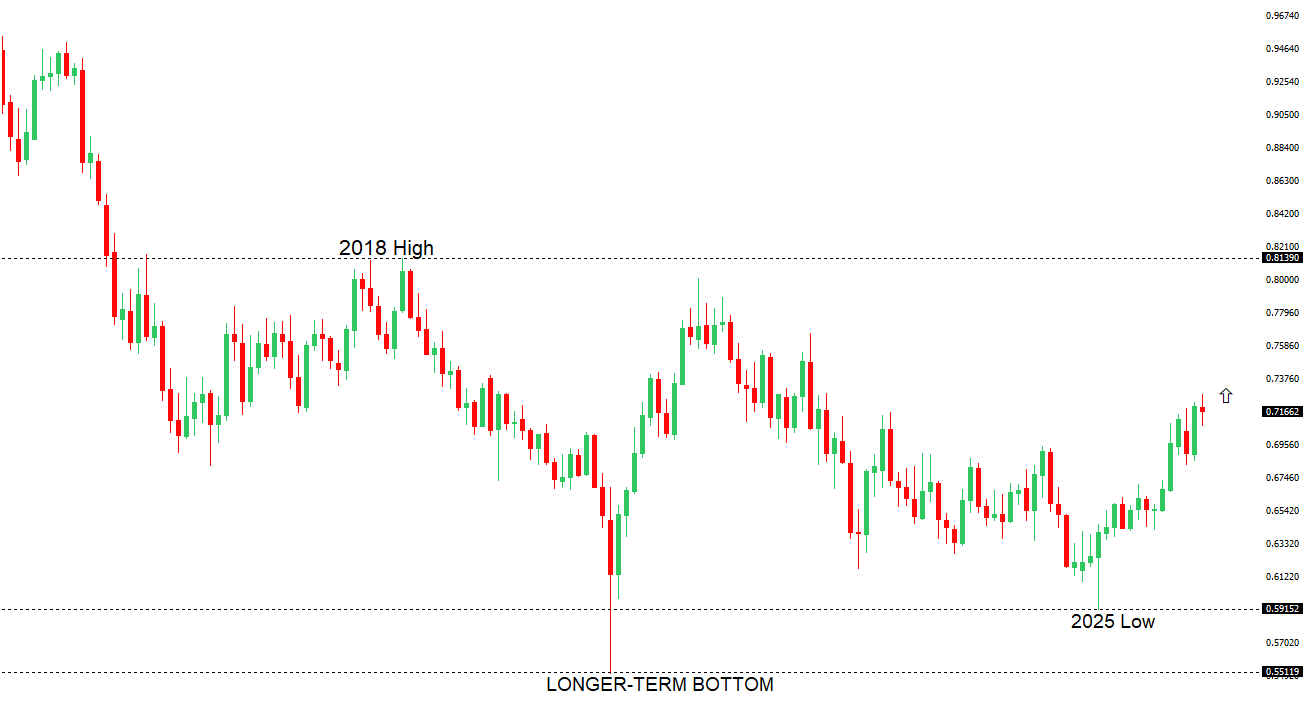 | ||
| R2 0.7278 - 6 May/2026 high - Strong R1 0.7222 - 17 April high - Medium S1 0.7079 - 19 May low - Medium S2 0.6963 - 8 April low - Strong | ||
| AUDUSD: fundamental overview | ||
| The Australian dollar has been driven primarily by shifting RBA expectations, softer inflation data, and ongoing swings in global risk sentiment tied to China and the Middle East. Australia’s April CPI slowed more than expected, with headline inflation easing to 4.2% y/y from 4.6%, while monthly prices unexpectedly fell as fuel costs retreated following March’s surge, reinforcing market expectations that the RBA is likely to pause after already delivering three rate hikes this year. At the same time, underlying inflation remains sticky, with trimmed-mean CPI edging up to 3.4%, suggesting the Bank will retain a cautious tightening bias even as slowing labor market conditions — including a rise in unemployment to 4.5% — argue for patience. Externally, the AUD continues to trade as a proxy for global growth and commodity demand, with resilient iron ore imports into China and firmer commodity prices offering support, although concerns around weaker Chinese steel production and broader China growth risks remain a headwind. Meanwhile, volatility surrounding the Iran conflict and energy markets has added another layer of uncertainty for the currency through its impact on global risk appetite and commodity prices. | ||
| Suggested reading | ||
| For Michael Burry, This Time Is Different Once Again, J. Remsburg, InvestorPlace (May 23, 2026) Higher Rates, More Renovation, T. Slok, Apollo (May 23, 2026) | ||