


 | ||
| 1st June 2026 | view in browser | ||
| Priced for peace, hedged for conflict | ||
| Markets begin the week balancing resilient risk appetite against escalating Middle East uncertainty, with higher oil prices, a modest safe-haven bid in the US dollar, hawkish central bank rhetoric, and unresolved US-Iran negotiations emerging as the key drivers of FX, equities, and commodity price action. | ||
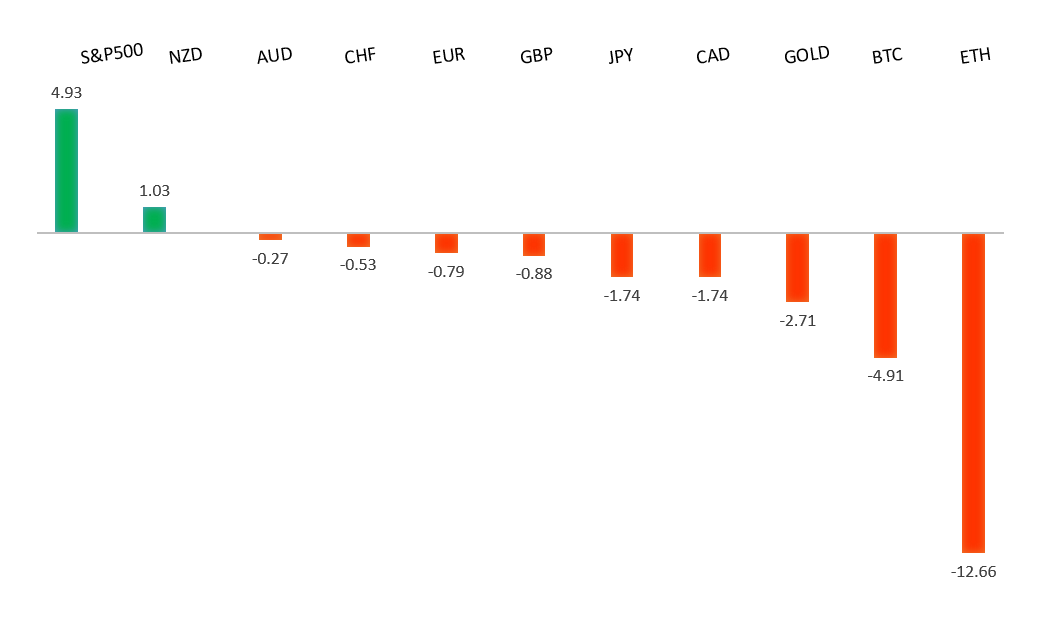
| Performance chart 30day v. USD (%) | ||
 | ||
| Technical & fundamental highlights | ||
| EURUSD: technical overview | ||
| The Euro outlook remains constructive with higher lows sought out on dips in favor of the next major upside extension targeting the 2021 high at 1.2350. Setbacks should be exceptionally well supported ahead of 1.1300. | ||
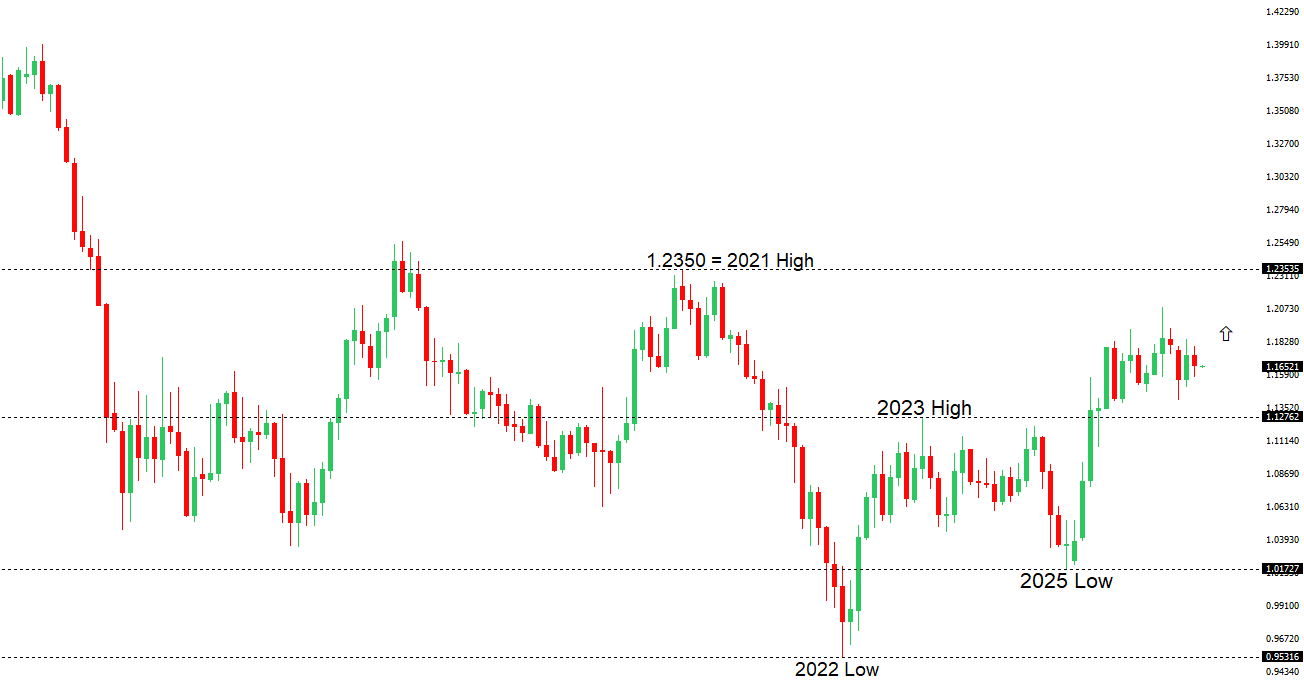 | ||
| R2 1.1797 - 6 May high - Medium R1 1.1722 - 14 May high - Medium S1 1.1576 - 21 May low - Medium S2 1.1504 - 3 April low - Strong | ||
| EURUSD: fundamental overview | ||
| The euro remains underpinned by a combination of ECB hawkishness and improving risk sentiment, with markets increasingly focused on the prospect of additional policy tightening from Frankfurt. The latest catalyst came from ECB Executive Board member Isabel Schnabel, who argued that the central bank can no longer look through the inflationary effects of the Iran conflict, warning that price pressures have broadened well beyond energy and that inflation expectations risk becoming unanchored. Importantly, Schnabel reframed the Iran shock as a more persistent global cost and demand shock rather than a temporary energy spike, signaling that further rate hikes remain firmly on the table and declining to place any ceiling on the tightening cycle. Markets are now fully pricing two additional ECB rate hikes over the next year and continue to assign meaningful odds of a third move. At the same time, tentative progress toward a longer-lasting ceasefire agreement between the US and Iran has helped support broader risk appetite, reducing some of the downside risks to the euro associated with energy supply disruptions. Against this backdrop, EURUSD remains supported on relative rate differentials, though gains have been tempered by a modest recovery in the US dollar ahead of this week’s key US labor market data, particularly the May nonfarm payrolls report. | ||
| USDJPY: technical overview | ||
| There are signs of the formation of a meaningful top after the market put in a multi-year high in 2024. At this point, rallies should be well capped above 160.00 in favor of a fresh down-leg back towards the 2024 low at 139.58. Only a monthly close above 160.00 negates. | ||
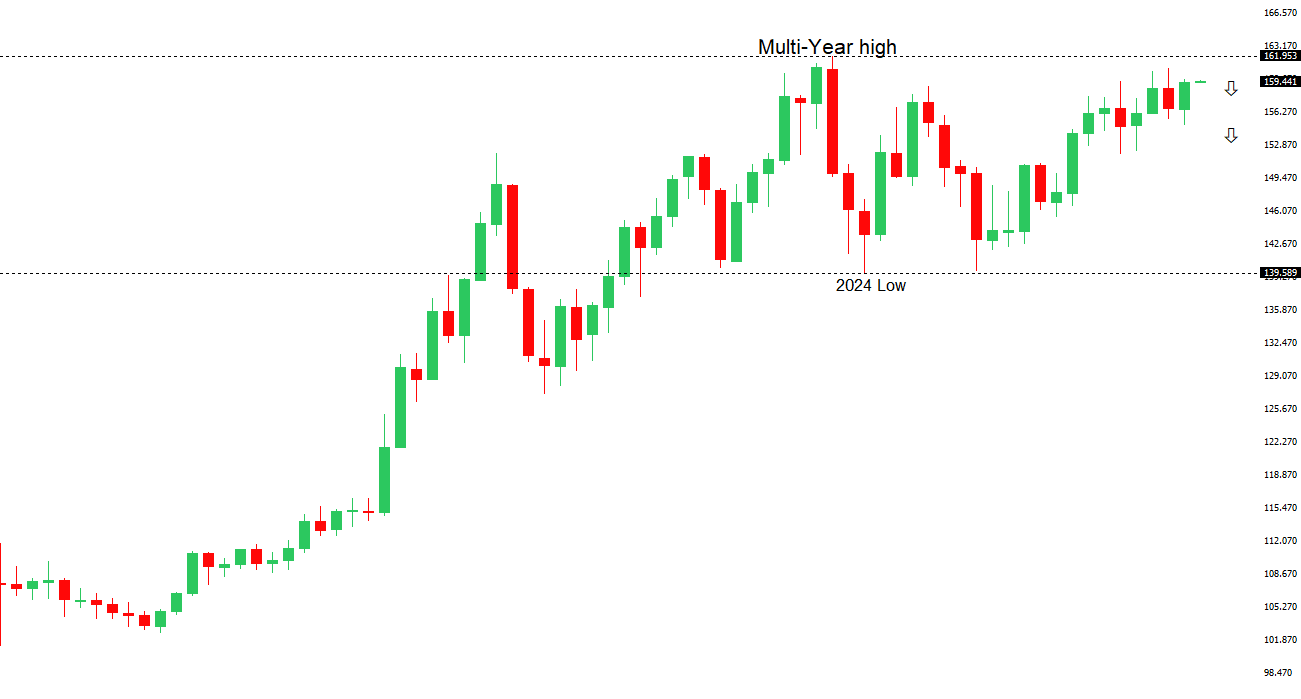 | ||
| R2 160.00 - Psychological - Strong R1 159.66 - 28 May high - Medium S1 158.59 - 20 May low - Medium S2 157.29 - 14 May low - Medium | ||
| USDJPY: fundamental overview | ||
| The Yen remains pressured by a combination of softer domestic growth signals and an unfavorable rate differential versus the US Dollar. The latest Ministry of Finance data showed Q1 corporate capital spending effectively stalled, rising just 0.047% y/y versus expectations for a 4.0% increase and slowing sharply from 6.5% in Q4, reinforcing expectations that Japan’s preliminary Q1 GDP growth estimate may be revised lower on June 8. The weak investment data, alongside concerns about the impact of elevated energy prices and Middle East tensions on Japan’s import-dependent economy, has largely offset support from increasingly hawkish Bank of Japan rhetoric. Governor Ueda recently reiterated concerns about inflation becoming more entrenched through second-round effects on wages and inflation expectations, keeping alive the prospect of further policy normalization. However, markets remain cautious about the BOJ’s ability to tighten aggressively given signs of slowing domestic demand and subdued capital expenditure despite strong corporate profits, which rose 14.6% y/y in Q1. At the same time, persistent yield spreads between US Treasuries and JGBs continue to favor Dollar demand, while resilient US economic data has encouraged investors to scale back Fed easing expectations. As a result, USDJPY remains supported despite growing expectations for further BOJ normalization, with incoming inflation data and the June GDP revision likely to play a key role in shaping near-term Yen direction. | ||
| AUDUSD: technical overview | ||
| There are signs of the formation of a longer-term base with the market recovering out from a meaningful longer-term support zone. The latest monthly close back above 0.7000 takes the big picture pressure off the downside and strengthens the case for a bottom, with the focus now on a push towards 0.8000. Setbacks should now be well supported ahead of 0.6700. | ||
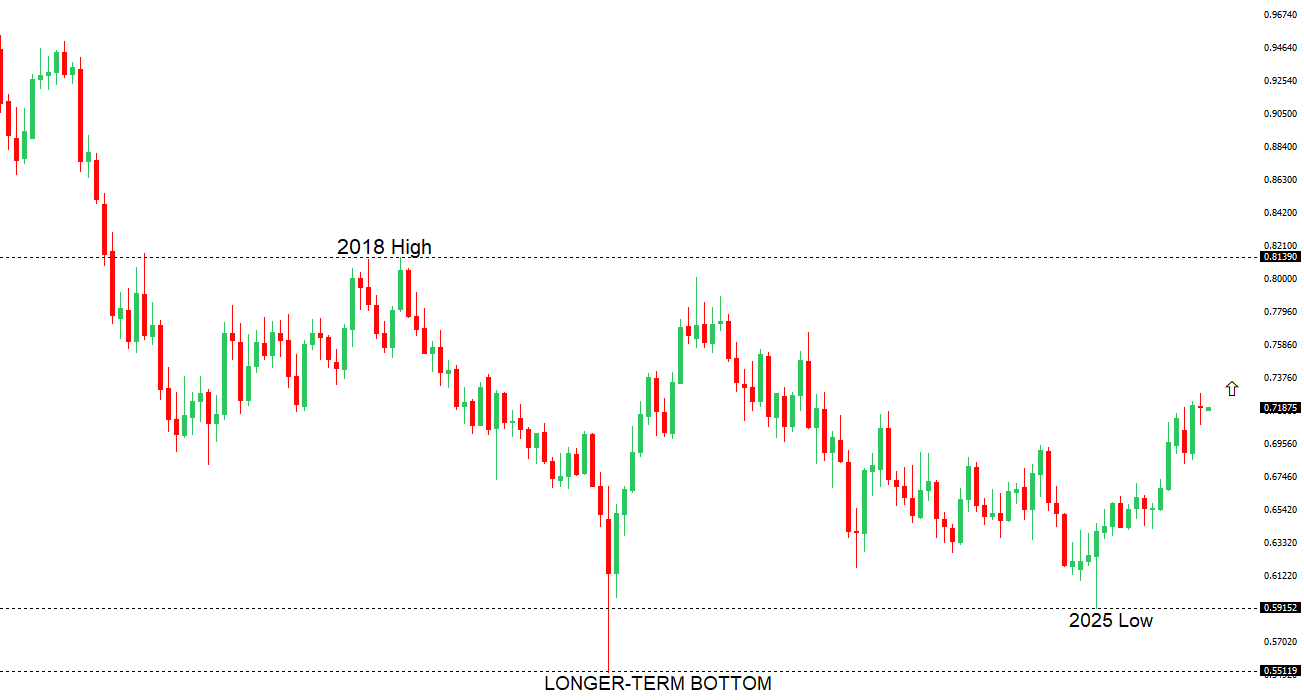 | ||
| R2 0.7278 - 6 May/2026 high - Strong R1 0.7222 - 17 April high - Medium S1 0.7079 - 19 May low - Medium S2 0.6963 - 8 April low - Strong | ||
| AUDUSD: fundamental overview | ||
| The Australian dollar has remained relatively resilient, with AUDUSD hovering just below the 0.7200 level and near recent two-week highs, supported by signs of stabilization in Chinese manufacturing activity and broader optimism around Australia’s key export outlook. However, gains continue to be capped by a stronger US dollar backdrop, as persistent US inflation pressures reinforce expectations that the Federal Reserve will keep policy restrictive for longer. Geopolitical uncertainty surrounding the fragile US-Iran ceasefire and ongoing concerns over the Strait of Hormuz have also underpinned safe-haven demand for the greenback. On the domestic side, markets have tempered expectations for further RBA tightening, reducing one source of support for the Aussie. Meanwhile, investors are also monitoring Beijing’s latest efforts to tighten oversight of outbound investment and technology transfers, a move that reinforces China’s focus on economic self-reliance and could have implications for future trade and investment flows across the region. More broadly, the AUD continues to take direction from China’s growth outlook, commodity price dynamics—particularly iron ore—and evolving interest rate expectations between the RBA and the Fed. | ||
| Suggested reading | ||
| Are consumers ready for humanoid robots?, C. Criddle, Financial Times (May 29, 2026) The AI Future we want, M. Murgia, Financial Times (May 31, 2026) | ||