


 | ||
| 14th May 2026 | view in browser | ||
| Dollar supported, Yuan strengthens as markets eye Trump–Xi talks | ||
| Markets are holding a cautiously risk-on tone, with equities supported by AI-driven earnings optimism, the dollar underpinned by firm U.S. inflation, and FX and commodities increasingly shaped by China policy signals and evolving geopolitical risks around the Trump–Xi summit and Middle East tensions. | ||
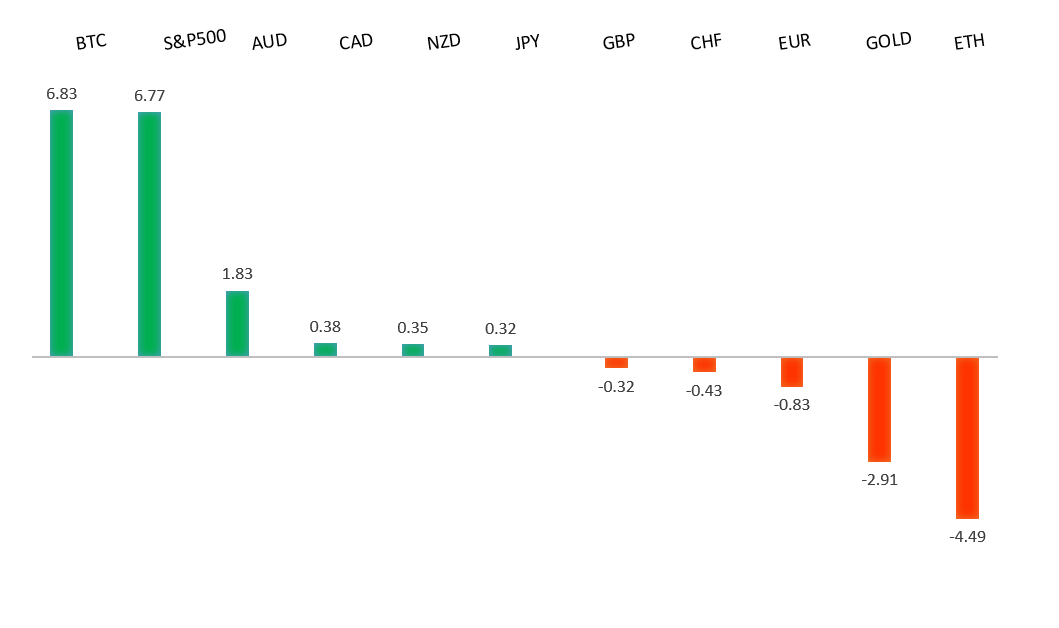
| Performance chart 30day v. USD (%) | ||
 | ||
| Technical & fundamental highlights | ||
| EURUSD: technical overview | ||
| The Euro outlook remains constructive with higher lows sought out on dips in favor of the next major upside extension targeting the 2021 high at 1.2350. Setbacks should be exceptionally well supported ahead of 1.1300. | ||
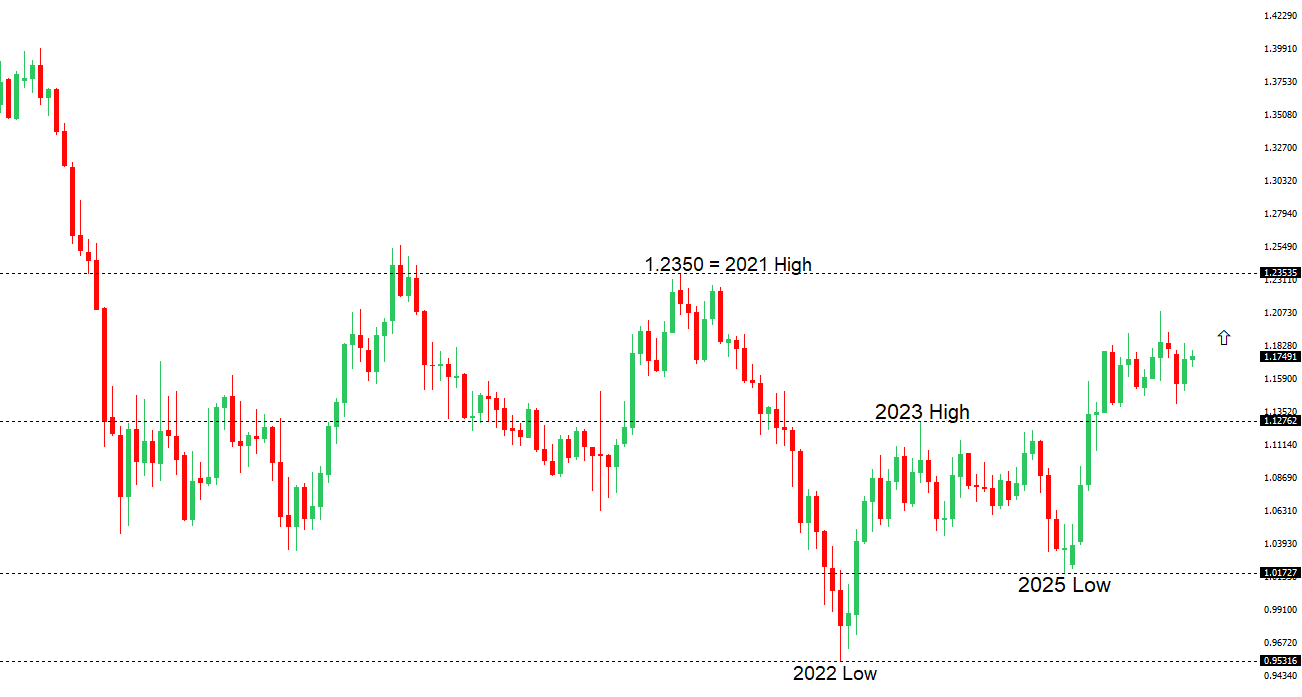 | ||
| R2 1.1850 - 17 April high - Strong R1 1.1797 - 6 May high - Medium S1 1.1650 - 9 April low - Medium S2 1.1589 - 8 April low - Strong | ||
| EURUSD: fundamental overview | ||
| The euro has managed to reclaim ground above 1.17, with the fundamental driver increasingly shifting toward a more hawkish repricing of European Central Bank policy expectations. Markets are now leaning firmly toward a June rate hike, with a strong majority of economists anticipating a 25bps move to 2.25%, as policymakers including Joachim Nagel warn that geopolitical risks—such as the Iran conflict—could add to inflation pressures. While Philip Lane has maintained a more cautious stance, the overall shift has been supportive for the euro, especially as it narrows perceived policy divergence with the Federal Reserve. On the US side, hotter-than-expected producer price data has helped underpin the dollar and limit EURUSD upside, reinforcing the idea that US disinflation remains uneven. From a near-term flow perspective, thinner liquidity conditions—owing to the Ascension Day holiday across parts of Europe—may also be amplifying price action, even as core markets remain open. Overall, the balance of drivers suggests the euro is being supported more by shifting ECB expectations than weakened US fundamentals, with incoming US data and ECB signaling key for direction from here. | ||
| USDJPY: technical overview | ||
| There are signs of the formation of a meaningful top after the market put in a multi-year high in 2024. At this point, rallies should be well capped above 160.00 in favor of a fresh down-leg back towards the 2024 low at 139.58. Only a monthly close above 160.00 negates. | ||
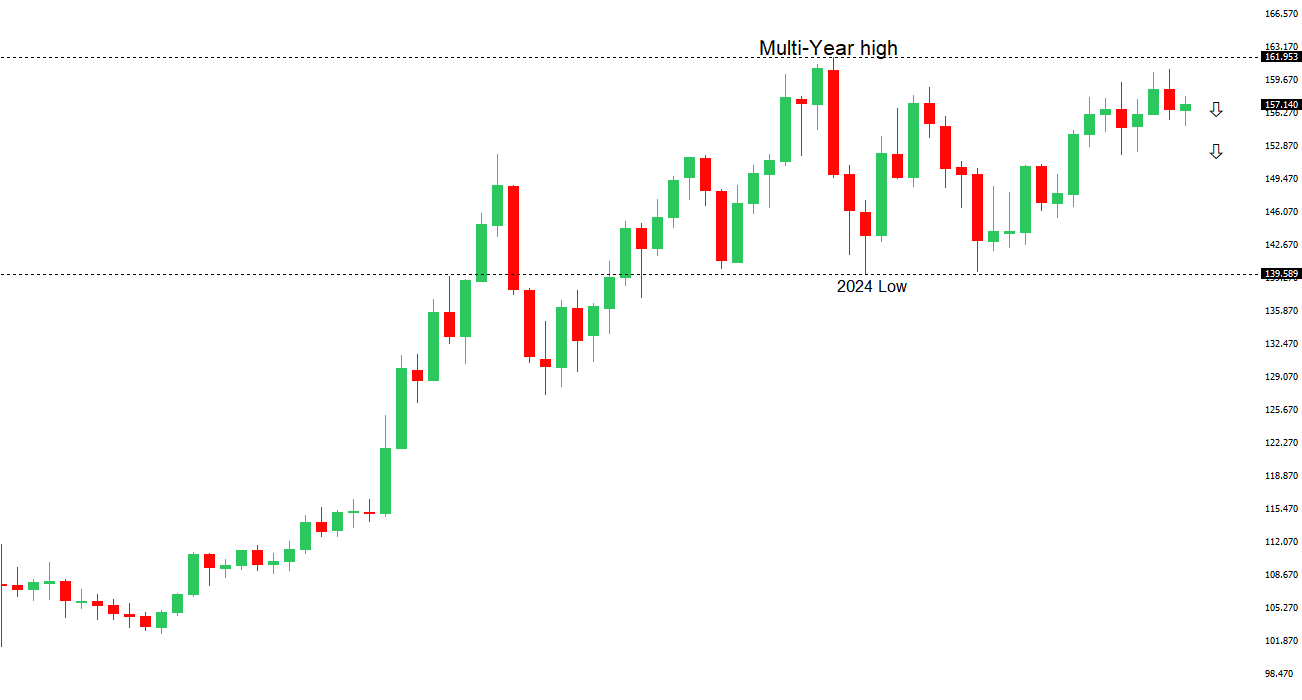 | ||
| R2 159.53 - 17 April low - Medium R1 158.00 - 14 May high - Medium S1 156.00 - Figure - Medium S2 155.02 - 6 May low - Strong | ||
| USDJPY: fundamental overview | ||
| The Yen continues to trade with a heavy but range-bound tone, driven primarily by persistent external yield pressures and tempered by rising domestic and policy-related considerations. Stronger-than-expected US inflation, particularly the upside surprise in PPI, has reinforced the “higher-for-longer” Fed narrative, keeping US-Japan rate differentials wide and maintaining downside pressure on the Yen. This dynamic is further amplified by relatively hawkish signals from the ECB, sustaining broader cross-Yen demand. At the same time, markets remain cautious ahead of key geopolitical developments, including the Trump–Xi summit and ongoing Iran-related risks, which are contributing to global uncertainty and energy price volatility, an especially negative backdrop for Japan’s import-heavy economy. On the domestic side, recent rhetoric from Kazuyuki Masu has added a nuanced layer, acknowledging that sustained Yen weakness could lift inflation expectations and push underlying inflation above target, while also signaling that Japan has effectively exited its deflationary phase. Although this introduces a more hawkish undertone and keeps the door open to further rate hikes, the Bank of Japan remains cautious and data-dependent, stopping short of any firm policy commitment. Meanwhile, ongoing concerns around FX intervention—backed by close coordination between Japanese and US authorities—are helping to anchor the currency and limit more aggressive depreciation, leaving the Yen caught between structurally bearish rate dynamics and intermittent support from policy risk and geopolitical uncertainty. | ||
| AUDUSD: technical overview | ||
| There are signs of the formation of a longer-term base with the market recovering out from a meaningful longer-term support zone. The latest monthly close back above 0.7000 takes the big picture pressure off the downside and strengthens the case for a bottom, with the focus now on a push towards 0.8000. Setbacks should now be well supported ahead of 0.6700. | ||
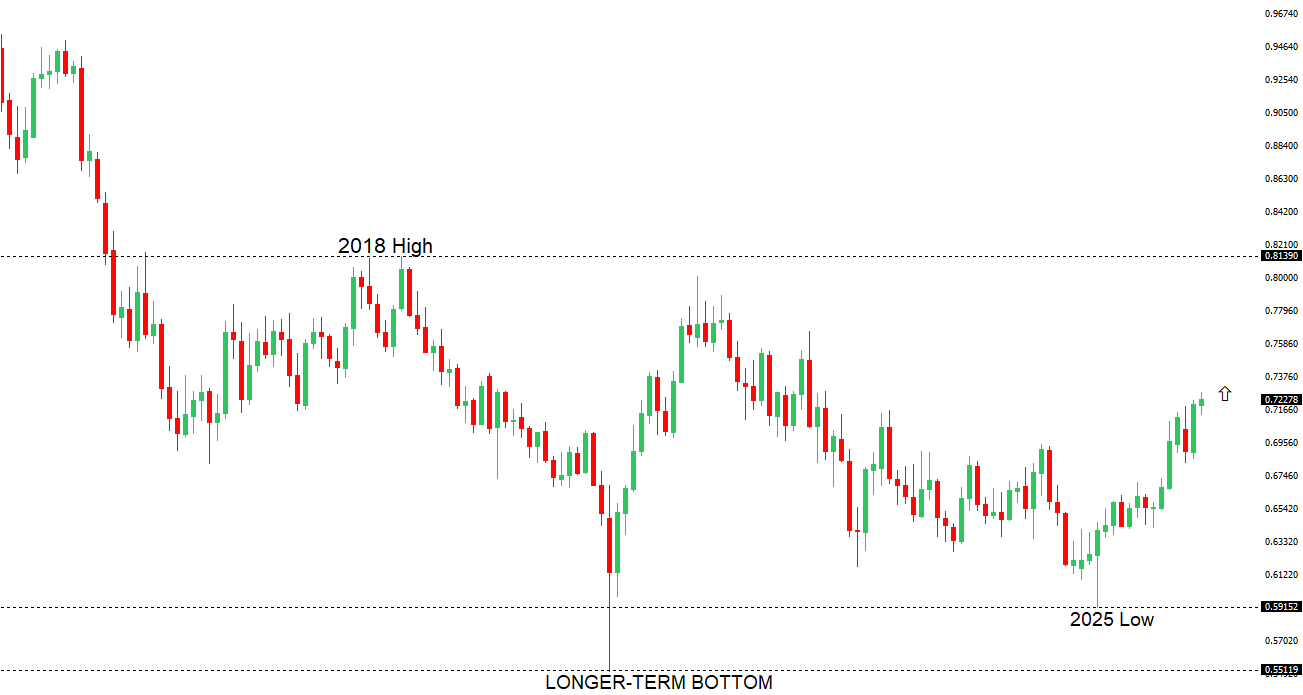 | ||
| R2 0.7300 - Figure - Medium R1 0.7278 - 6 May/2026 high - Medium S1 0.7101 - 30 April low - Medium S2 0.6963 - 8 April low - Strong | ||
| AUDUSD: fundamental overview | ||
| The Australian Dollar has come under renewed pressure, slipping back toward the mid-0.72s, primarily on the back of a stronger US Dollar following upside surprises in US inflation—most notably a sharp jump in producer prices, which has reinforced expectations that US rates will remain elevated for longer. This widening rate differential continues to weigh on the AUD, particularly in an environment where the Reserve Bank of Australia remains relatively cautious and data-dependent. At the same time, external drivers remain critical, with markets closely watching high-level US-China engagement, including talks between Donald Trump and Xi Jinping, given the Aussie’s sensitivity as a China proxy. Any signs of stabilization or improvement in China’s outlook—Australia’s largest trading partner—could offer support, but for now, softer global risk sentiment, resilient US data, and uncertainty around China’s growth trajectory are combining to keep the AUD on the defensive. | ||
| Suggested reading | ||
| Why Big Oil is opening new frontiers?, J. Smyth, Financial Times (May 14, 2026) Gold Is Sending On Ominous Message, B. Eichengreen, Project Syndicate (May 11, 2026) | ||