


 | ||
| 21st May 2026 | view in browser | ||
| Risk appetite masks global divergence | ||
| Markets remain broadly supported by AI-driven US equity optimism and softer US yields, but beneath the surface investors are navigating increasingly divergent central bank paths, weakening Asian growth signals, and rising geopolitical risks. | ||
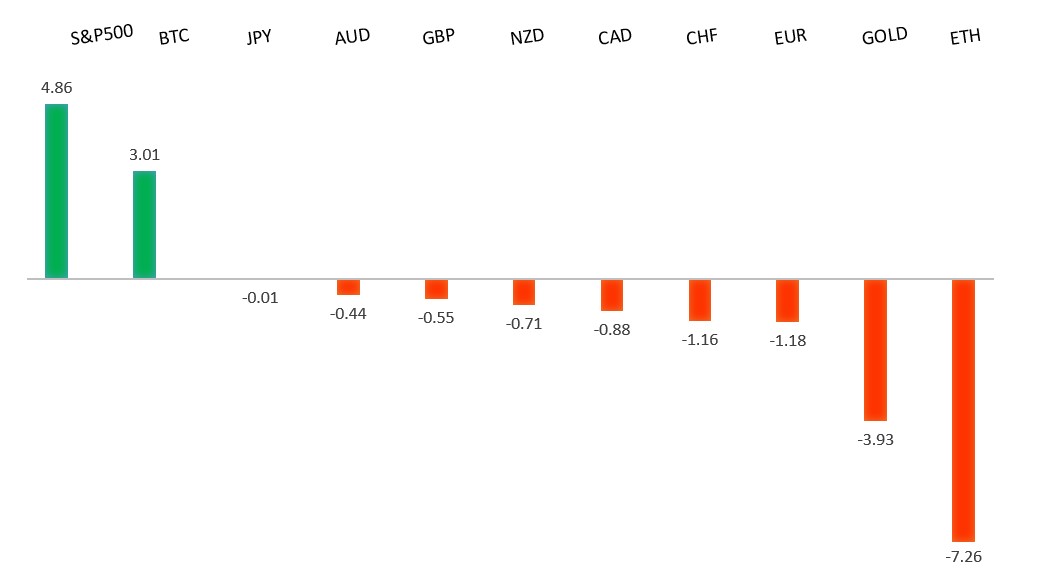
| Performance chart 30day v. USD (%) | ||
 | ||
| Technical & fundamental highlights | ||
| EURUSD: technical overview | ||
| The Euro outlook remains constructive with higher lows sought out on dips in favor of the next major upside extension targeting the 2021 high at 1.2350. Setbacks should be exceptionally well supported ahead of 1.1300. | ||
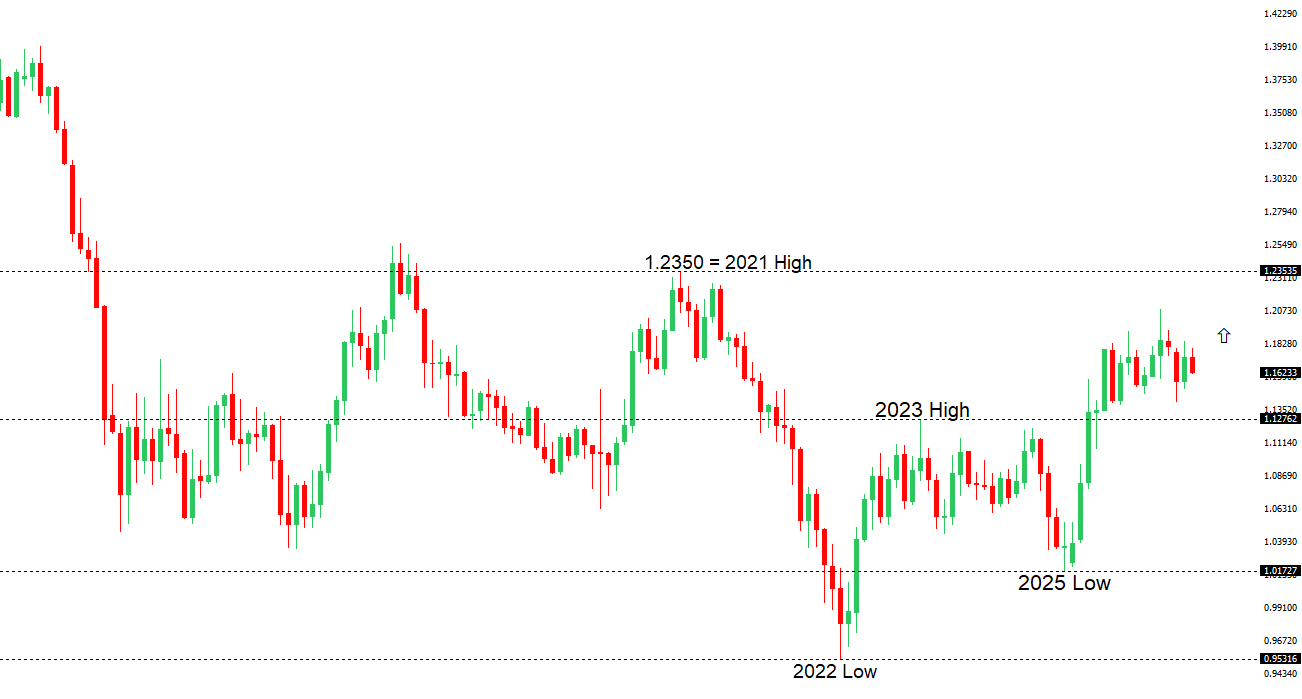 | ||
| R2 1.1797 - 6 May high - Medium R1 1.1722 - 14 May high - Medium S1 1.1583 - 20 May low - Medium S2 1.1504 - 3 April low - Strong | ||
| EURUSD: fundamental overview | ||
| The euro has remained underpinned by a still constructive ECB policy outlook and improving regional data expectations, although gains against the dollar have stalled near the 1.16 area amid a renewed bid for USD safety. Markets continue to price a relatively cautious easing cycle from the ECB, with recent Reuters polling showing a growing majority of economists expecting another 25bp rate increase in June to 2.25%, reflecting concerns that Eurozone inflation pressures remain sticky enough to warrant further restraint. At the same time, preliminary May PMI releases from Germany and the broader Eurozone are in focus for signs that activity momentum is stabilizing after a soft start to the year, particularly in services. However, broader geopolitical tensions and a more hawkish Fed narrative have tempered euro upside. Escalating rhetoric surrounding US-Iran negotiations has supported safe-haven demand for the dollar, while the latest Fed minutes reinforced expectations that US rates may need to stay restrictive for longer should inflation remain persistent. The widening contrast between resilient US yields and still fragile Eurozone growth dynamics has limited EURUSD follow-through despite relatively firm ECB expectations. | ||
| USDJPY: technical overview | ||
| There are signs of the formation of a meaningful top after the market put in a multi-year high in 2024. At this point, rallies should be well capped above 160.00 in favor of a fresh down-leg back towards the 2024 low at 139.58. Only a monthly close above 160.00 negates. | ||
 | ||
| R2 159.53 - 17 April low - Medium R1 159.25 - 19 May high - Medium S1 157.29 - 14 May low - Medium S2 155.02 - 6 May low - Strong | ||
| USDJPY: fundamental overview | ||
| The yen remains caught between increasingly hawkish Bank of Japan expectations and rising concerns over Japan’s growth and fiscal outlook. BOJ board member Koeda delivered one of the clearest tightening signals yet, arguing that underlying inflation is already around 2% and warning that persistent Middle East-driven energy pressures risk pushing it higher, reinforcing expectations that the BOJ could continue normalizing policy as soon as June. Markets have also focused on Koeda’s argument that keeping rates too low risks further distortions from deeply negative real interest rates, a notable shift toward a more proactive inflation-fighting stance. At the same time, Japan’s latest PMI data highlighted an increasingly uncomfortable mix of slowing activity and intensifying price pressures, with services activity stalling while selling price inflation accelerated to the strongest pace in nearly 19 years. Trade data added to the stagflationary undertone: although April exports beat expectations and produced a surprise trade surplus, the improvement was flattered by a historic collapse in crude oil imports amid Middle East supply disruption, raising concerns that higher energy costs and wider trade deficits will emerge in coming months. Meanwhile, rising fiscal worries tied to discussion of additional stimulus spending and multi-decade highs in JGB yields have added another layer of pressure on the yen, leaving USDJPY driven by the tension between a more hawkish BOJ on one side and deteriorating growth, energy shock risks and fiscal concerns on the other. | ||
| AUDUSD: technical overview | ||
| There are signs of the formation of a longer-term base with the market recovering out from a meaningful longer-term support zone. The latest monthly close back above 0.7000 takes the big picture pressure off the downside and strengthens the case for a bottom, with the focus now on a push towards 0.8000. Setbacks should now be well supported ahead of 0.6700. | ||
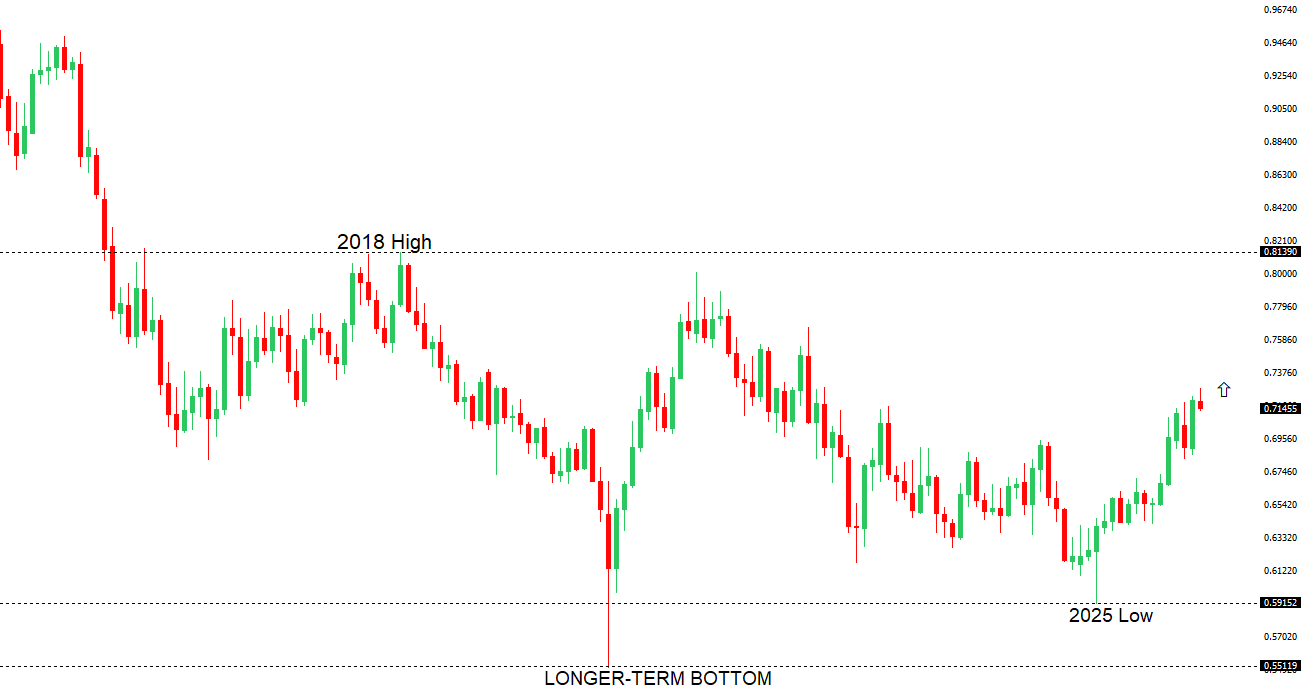 | ||
| R2 0.7300 - Figure - Medium R1 0.7278 - 6 May/2026 high - Medium S1 0.7079 - 19 May low - Medium S2 0.6963 - 8 April low - Strong | ||
| AUDUSD: fundamental overview | ||
| The Australian Dollar has come under renewed pressure as a sharp deterioration in domestic data has reinforced expectations that the Reserve Bank of Australia will pause its tightening cycle, or potentially begin discussing eventual easing if labor market weakness deepens. April employment unexpectedly fell by 18.6k against expectations for a 17.5k increase, while the unemployment rate climbed to 4.5%, its highest level since late 2021 and above the RBA’s own forecast trajectory. The weakness was broad-based across both full- and part-time employment, while youth unemployment moved above 11%, historically an early warning signal for wider economic slowing. At the same time, May flash PMI data pointed to a rapid loss of momentum in activity, with services slipping back into contraction territory and business confidence falling toward pandemic-era lows. The softer domestic backdrop has seen markets scale back RBA hike expectations, weighing on yield support for the AUD. Externally, the currency has also been pressured by a firmer US Dollar amid renewed geopolitical tension surrounding US-Iran negotiations and risks to Middle East energy supply routes, although elevated commodity and energy prices continue to provide some offsetting support for Australia’s terms of trade. | ||
| Suggested reading | ||
| All New Highs Are Not Created Equal, J. Parets, Trend Labs (May 18, 2026) Bonds Are Behaving Just Like…Bonds, J. Wiggins, Behavioral Investment (May 19, 2026) | ||