


 | ||
| 20th May 2026 | view in browser | ||
| Caught between war risk and rate risk | ||
| Markets remain dominated by the inflationary implications of the Iran-Hormuz crisis, with surging oil prices, rising global yields, hawkish central bank repricing and persistent geopolitical uncertainty driving defensive positioning across FX, equities and commodities. | ||
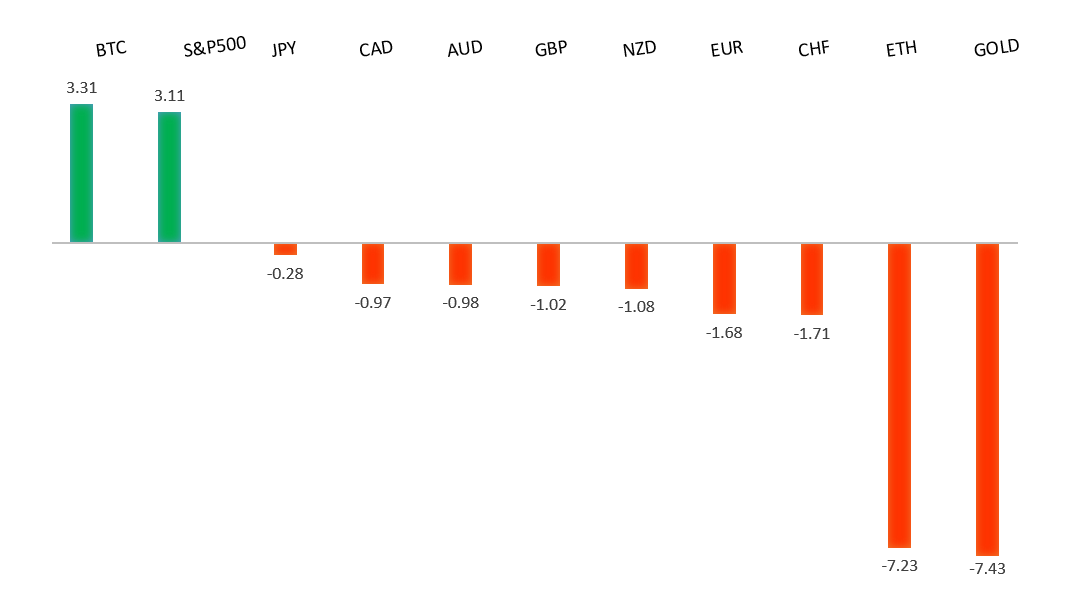
| Performance chart 30day v. USD (%) | ||
 | ||
| Technical & fundamental highlights | ||
| EURUSD: technical overview | ||
| The Euro outlook remains constructive with higher lows sought out on dips in favor of the next major upside extension targeting the 2021 high at 1.2350. Setbacks should be exceptionally well supported ahead of 1.1300. | ||
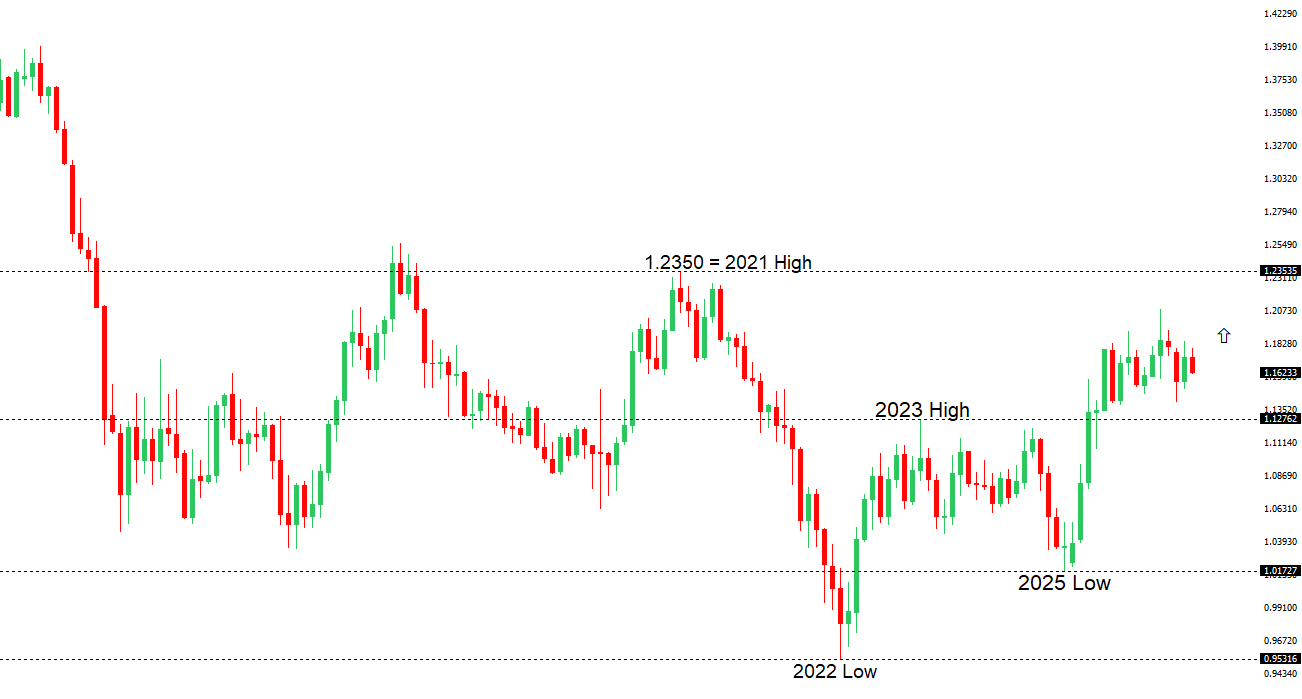 | ||
| R2 1.1797 - 6 May high - Medium R1 1.1722 - 14 May high - Medium S1 1.1589 - 8 April low - Medium S2 1.1504 - 3 April low - Strong | ||
| EURUSD: fundamental overview | ||
| The euro remains under pressure after Tuesday’s bearish session pushed the single currency to its weakest levels since April, as investors continue to favor the dollar amid rising US yields and a deteriorating global risk backdrop. Market sentiment has turned increasingly defensive on fears that tensions in the Middle East could escalate again if Iran fails to reach a deal with the United States, boosting safe-haven demand for the greenback. At the same time, US Treasury yields have surged, with the 10-year yield climbing to fresh multi-year highs as markets further scale back expectations for Federal Reserve rate cuts this year following resilient US economic data and persistent inflation concerns. While the euro has found some underlying support from signs of easing transatlantic trade tensions after the EU moved closer to ratifying its trade accord with the US, helping reduce risks of a broader tariff conflict, the positive impact has so far been overshadowed by widening US-Eurozone rate differentials and softer sentiment toward European assets. Investors are now looking ahead to the upcoming FOMC minutes and May flash PMI data from both the Eurozone and the US for further direction on relative growth and policy expectations. | ||
| USDJPY: technical overview | ||
| There are signs of the formation of a meaningful top after the market put in a multi-year high in 2024. At this point, rallies should be well capped above 160.00 in favor of a fresh down-leg back towards the 2024 low at 139.58. Only a monthly close above 160.00 negates. | ||
 | ||
| R2 159.53 - 17 April low - Medium R1 159.25 - 19 May high - Medium S1 157.29 - 14 May low - Medium S2 155.02 - 6 May low - Strong | ||
| USDJPY: fundamental overview | ||
| The yen has found some near-term support after Japan’s economy surprised to the upside in Q1, with GDP expanding at an annualized 2.1% pace and reinforcing expectations that the BOJ will continue gradually normalizing policy. At the same time, growing concern over official intervention has helped slow the pace of JPY weakness as USDJPY approaches the psychologically important 160 level, with Finance Minister Katayama reiterating that authorities stand ready to respond to excessive FX volatility and markets suspecting Tokyo already intervened aggressively earlier this spring. More broadly, improving domestic fundamentals are beginning to shift sentiment around the yen, with one major US bank upgrading its view to neutral from bearish while citing rising Japanese real rates, stronger Japanese equity performance, and improving structural capital flow dynamics as medium-term supportive factors. That said, the yen continues to face a significant headwind from wide US-Japan rate differentials as resilient US inflation and elevated energy prices reinforce a higher-for-longer Fed outlook, keeping US yields elevated and preserving the attractiveness of dollar assets relative to Japan. | ||
| AUDUSD: technical overview | ||
| There are signs of the formation of a longer-term base with the market recovering out from a meaningful longer-term support zone. The latest monthly close back above 0.7000 takes the big picture pressure off the downside and strengthens the case for a bottom, with the focus now on a push towards 0.8000. Setbacks should now be well supported ahead of 0.6700. | ||
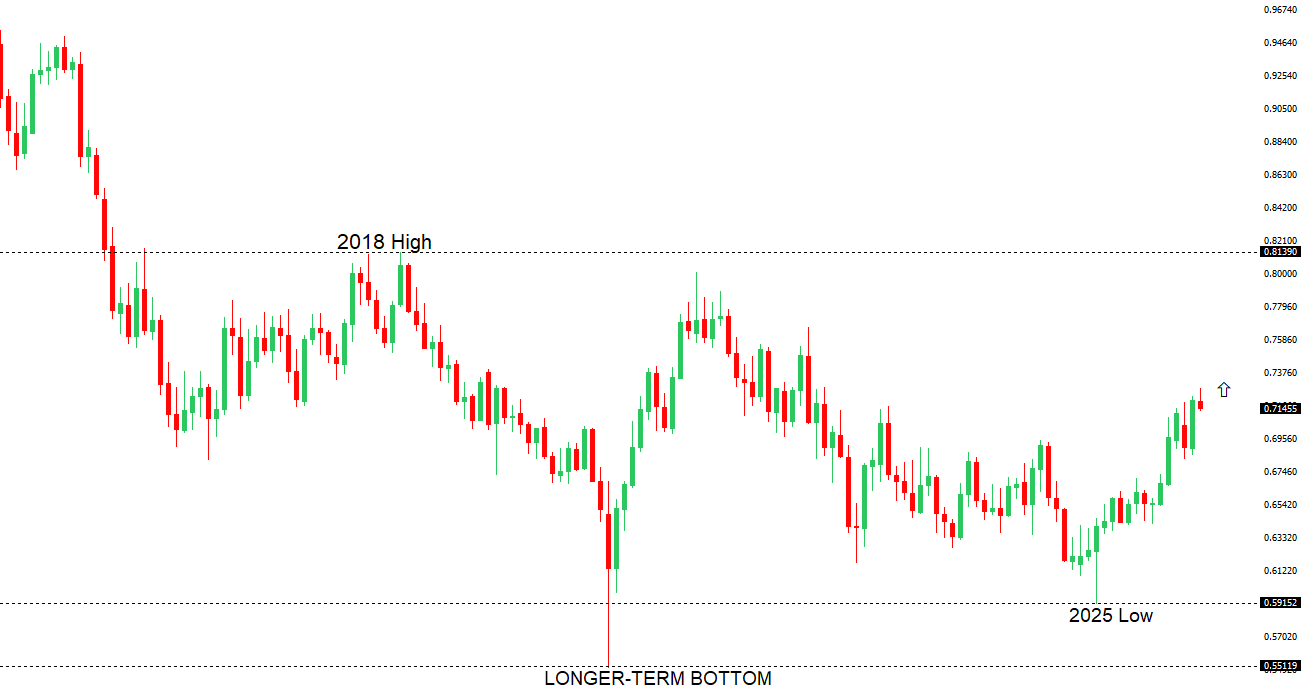 | ||
| R2 0.7300 - Figure - Medium R1 0.7278 - 6 May/2026 high - Medium S1 0.7079 - 19 May low - Medium S2 0.6963 - 8 April low - Strong | ||
| AUDUSD: fundamental overview | ||
| The Australian dollar has remained under pressure in recent sessions, with AUDUSD slipping back below 0.7100 as a resurgent US dollar, heightened geopolitical tensions in the Middle East, and rising oil prices have reinforced demand for safe-haven assets. Markets have increasingly priced in the risk that renewed conflict involving Iran could reignite global inflation pressures, prompting investors to scale back expectations for aggressive Fed easing and instead lean toward a more hawkish US rates outlook. While the RBA has maintained a relatively hawkish bias — with minutes showing most board members supported the May rate hike to 4.35% amid concerns that higher fuel costs could further lift inflation expectations — this has been outweighed by broader USD strength and risk aversion. At the same time, Australia’s close trade ties with China remain an important offsetting factor for the AUD, with sentiment supported somewhat by signs of improving US-China trade relations following the Kuala Lumpur framework agreement, including plans for reciprocal tariff reductions and large-scale Chinese purchases of US goods. Still, with China’s growth backdrop remaining uneven and the PBOC keeping policy settings unchanged, external risk sentiment and US rate dynamics continue to dominate near-term AUD direction. | ||
| Suggested reading | ||
| AI Is Penetrating Every Corner of Financial Markets, T. Slok, Apollo (May 18, 2026) If the Consensus Is Wrong, Stocks Are Pricey, J. Calhoun, Alhambra (May 17, 2026) | ||