


 | ||
| 19th May 2026 | view in browser | ||
| Headline risk keeps investors defensive | ||
| Global markets remain trapped in a fragile, headline-driven risk environment as persistent Middle East tensions keep oil prices elevated, US yields high, the dollar broadly supported, and investors increasingly defensive across FX, equities, and commodities. | ||
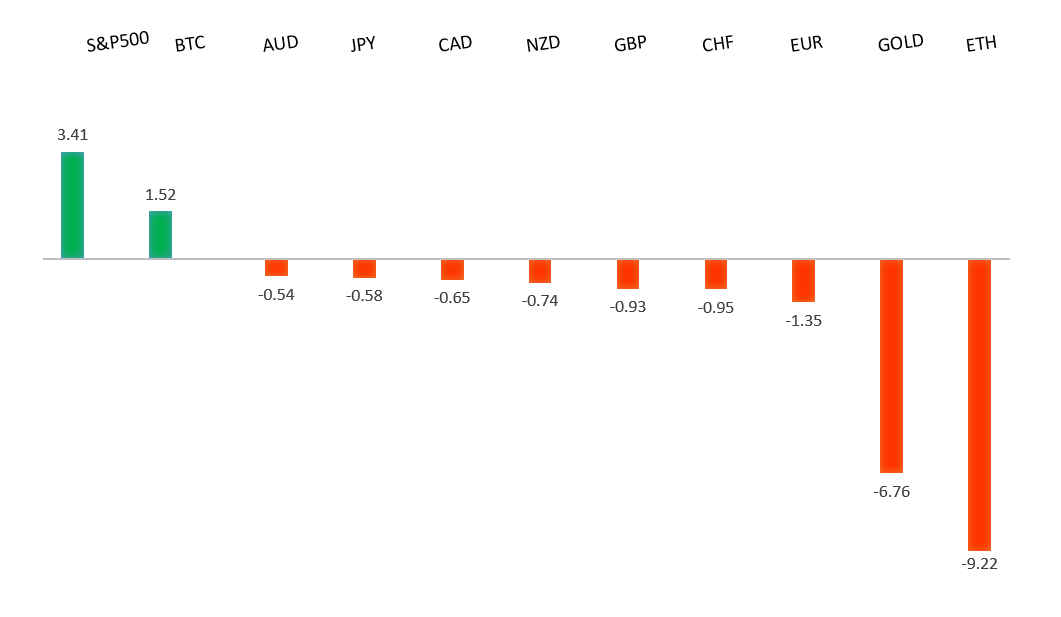
| Performance chart 30day v. USD (%) | ||
 | ||
| Technical & fundamental highlights | ||
| EURUSD: technical overview | ||
| The Euro outlook remains constructive with higher lows sought out on dips in favor of the next major upside extension targeting the 2021 high at 1.2350. Setbacks should be exceptionally well supported ahead of 1.1300. | ||
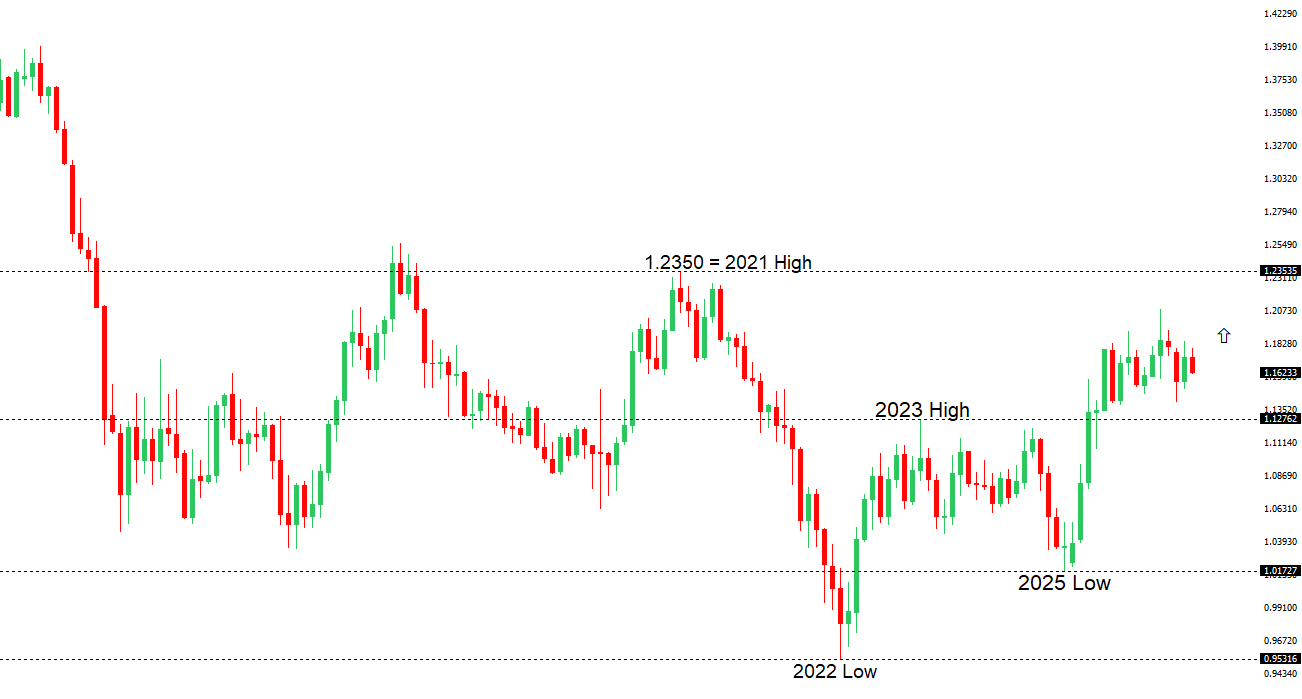 | ||
| R2 1.1797 - 6 May high - Medium R1 1.1722 - 14 May high - Medium S1 1.1608 - 18 May low - Medium S2 1.1589 - 8 April low - Strong | ||
| EURUSD: fundamental overview | ||
| The euro has come under renewed pressure, with EURUSD slipping back below 1.1650 as escalating uncertainty around Iran and the broader Middle East conflict continues to underpin safe-haven demand for the US dollar. While President Trump delayed a planned strike on Iran following requests from Gulf states including Saudi Arabia, Qatar and the UAE, markets remain cautious after warnings that military action could still proceed at short notice if negotiations fail. At the same time, the downside in the single currency has been cushioned by a more hawkish ECB backdrop, with policymakers increasingly signaling concern over sticky inflation and the risk of inflation expectations becoming entrenched. ECB Governing Council member Yannis Stournaras said a modest rate hike could help contain price pressures without materially damaging growth, while markets have moved to more fully price another 25bp ECB hike in June. The repricing higher in ECB rate expectations has helped limit euro losses even as geopolitical tensions and broader risk aversion continue to favor the dollar in the near term. | ||
| USDJPY: technical overview | ||
| There are signs of the formation of a meaningful top after the market put in a multi-year high in 2024. At this point, rallies should be well capped above 160.00 in favor of a fresh down-leg back towards the 2024 low at 139.58. Only a monthly close above 160.00 negates. | ||
 | ||
| R2 159.53 - 17 April low - Medium R1 159.08 - 18 May high - Medium S1 157.29 - 14 May low - Medium S2 155.02 - 6 May low - Strong | ||
| USDJPY: fundamental overview | ||
| Japan’s Q1 GDP data offered the yen some fundamental support after growth surprised to the upside at 2.1% annualized, with consumption, capex and inflation metrics all beating expectations, reinforcing the view that the economy had entered the current geopolitical shock on relatively solid footing. However, the positive domestic backdrop has quickly been overshadowed by the fallout from the Iran conflict and the associated surge in energy prices, with Japan viewed as particularly vulnerable given its heavy dependence on Middle East oil imports. Markets have subsequently pared back expectations for near-term BOJ tightening, with concerns mounting that the central bank may be forced to delay further rate hikes if the energy shock tips Q2 growth into contraction despite still-elevated inflation pressures. At the same time, the yen continues to suffer under the weight of the wide US-Japan rate differential as Fed hawkishness and higher US Treasury yields keep demand for the dollar supported. Japanese officials have intensified intervention rhetoric as USDJPY moves back toward the 160 area, with Finance Minister Katayama reiterating that authorities stand ready to act against excessive FX volatility after an estimated ¥10 trillion of intervention since late April. Still, markets remain skeptical that unilateral intervention alone can sustainably reverse yen weakness absent a more meaningful shift in BOJ policy or a broader decline in US yields. | ||
| AUDUSD: technical overview | ||
| There are signs of the formation of a longer-term base with the market recovering out from a meaningful longer-term support zone. The latest monthly close back above 0.7000 takes the big picture pressure off the downside and strengthens the case for a bottom, with the focus now on a push towards 0.8000. Setbacks should now be well supported ahead of 0.6700. | ||
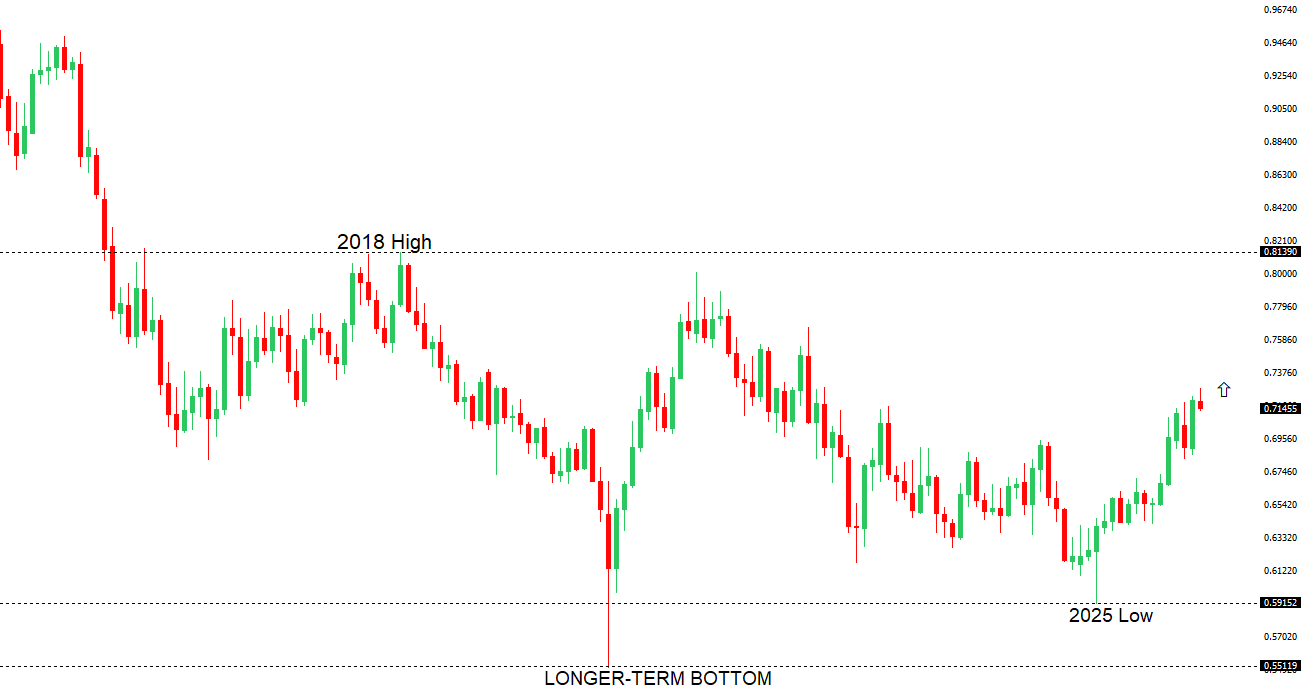 | ||
| R2 0.7300 - Figure - Medium R1 0.7278 - 6 May/2026 high - Medium S1 0.7101 - 30 April low - Medium S2 0.6963 - 8 April low - Strong | ||
| AUDUSD: fundamental overview | ||
| The Australian Dollar remains under pressure as a resilient US Dollar and elevated global risk aversion continue to outweigh an increasingly hawkish Reserve Bank of Australia. While the latest RBA Minutes reinforced expectations for further tightening – revealing that eight of nine board members backed May’s hike to 4.35% amid concerns that energy-driven inflation and the Middle East conflict could de-anchor inflation expectations – the Aussie has struggled to benefit as markets instead gravitate toward the safe-haven USD. Investors remain focused on geopolitical uncertainty surrounding Iran and the Strait of Hormuz, with oil prices staying elevated and broader fears over global growth and trade-sensitive currencies weighing on sentiment toward the AUD. At the same time, firmer US data and persistent Fed hawkishness have revived expectations that US rates could remain higher for longer, further supporting the Greenback and narrowing the relative appeal of the Australian Dollar. Domestically, concerns are also building that tighter financial conditions and slowing Chinese demand could weigh on Australia’s growth outlook, even as sticky inflation keeps the RBA biased toward additional hikes later this year. | ||
| Suggested reading | ||
| The 4 Abilities You Need To Be A Successful Investor, B. Carlson, AWOC (May 15, 2026) Don’t Be Someone Else’s Exit Liquidity, J. Parets, Trend Labs (May 15, 2026) | ||