


 | ||
| 14th October 2026 | view in browser | ||
| A softer dollar, a harder inflation test | ||
| Markets head into Wednesday with the dollar softer and risk sentiment stabilizing, as investors await US inflation data to determine whether elevated energy prices justify further Fed tightening or leave room for a broader relief rally. | ||
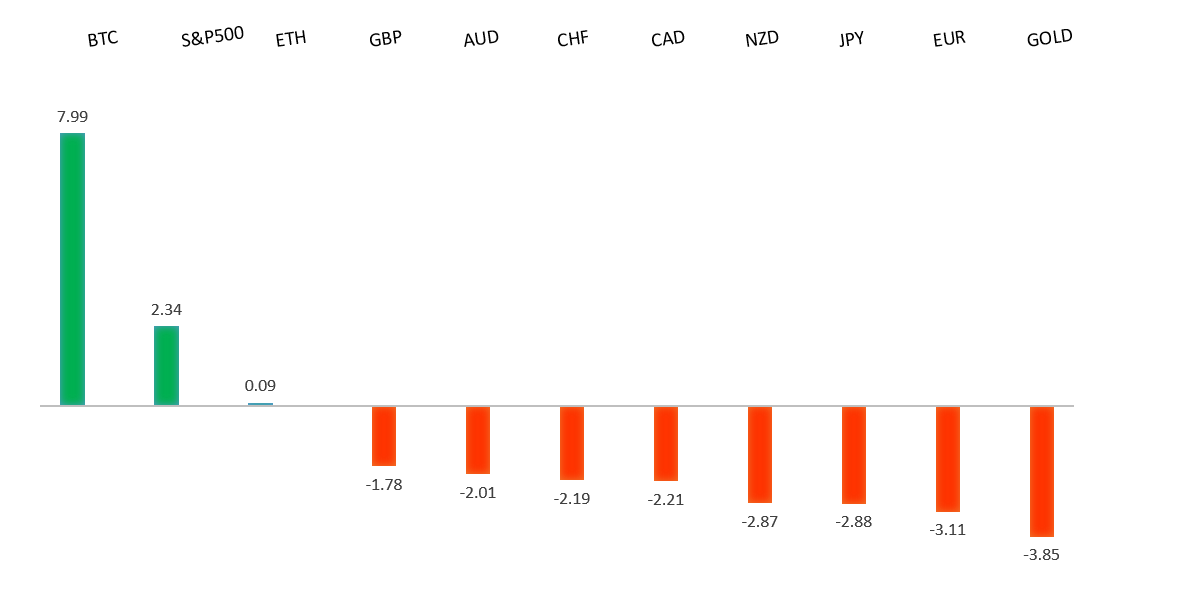
| Performance chart 30day v. USD (%) | ||
 | ||
| Technical & fundamental highlights | ||
| EURUSD: technical overview | ||
| The Euro continues to show signs of wanting to carve out a major bottom after trading down to a 20-year low in 2022. Setbacks should be exceptionally well supported above 1.1200 on a weekly close basis ahead of the next major upside extension back above 1.2000. | ||
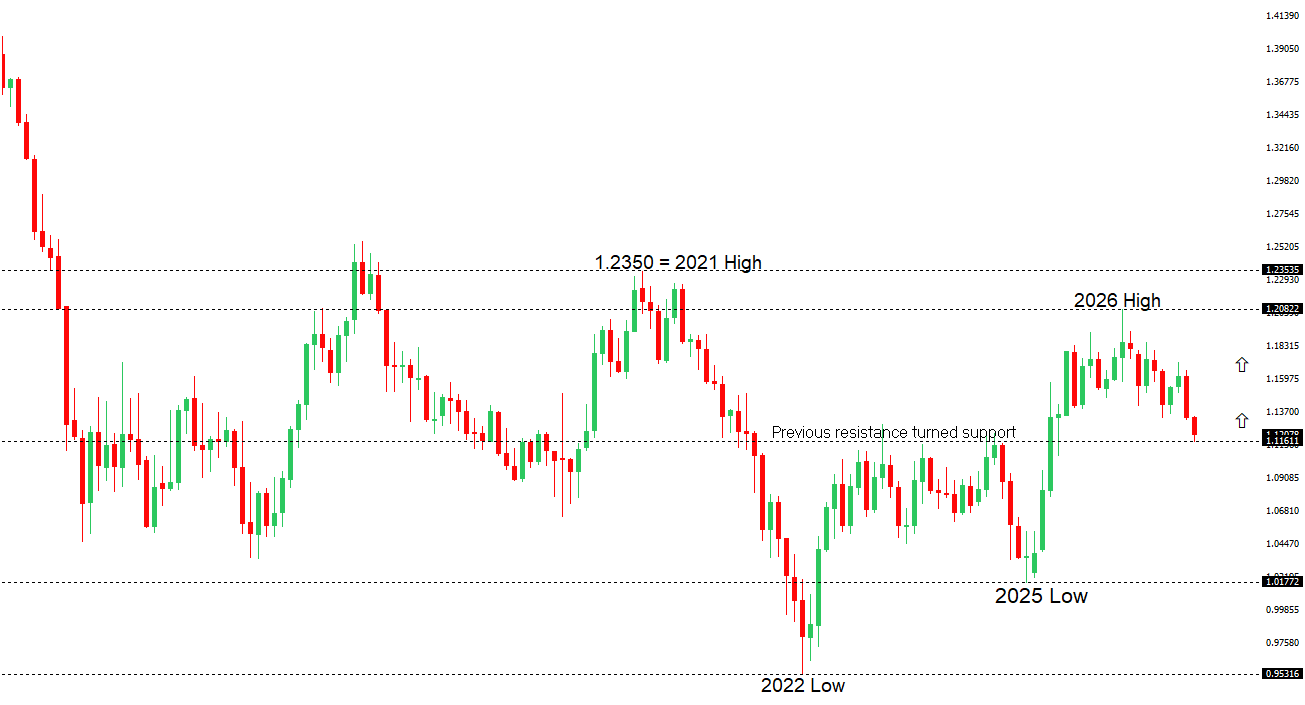 | ||
| R2 1.1337 - 1 October high - Medium R1 1.1286 - 2 October high - Medium S1 1.1152 - 13 Octoberber/2026 low - Strong S2 1.1100 - Figure - Strong | ||
| EURUSD: fundamental overview | ||
| The euro is drawing modest support from an ECB stance that remains alert to inflation risks without signaling an urgent need for further tightening. Lagarde stressed that rising prices are largely energy-driven and have yet to feed into second-round effects, although wage negotiations remain a key area of scrutiny. This leaves policymakers balancing the risk of more persistent inflation against subdued growth, limiting the scope for a decisively hawkish shift. French debt concerns remain a potential headwind, with Lagarde placing responsibility for addressing them squarely on fiscal policy. Overall, the remarks offer some reassurance but little fresh impetus for a sustained euro rally, leaving the currency sensitive to shifts in US rate expectations and broader dollar sentiment. | ||
| GBPUSD: technical overview | ||
| The Pound remains exceptionally well supported on dips into the 1.3000 area, with the price largely consolidating above the psychological barrier and previous resistance turned support in the form of the 2023 high. Look for the market to continue be well supported on dips ahead of the next major upside extension through the yearly high at 1.3870 and towards a retest of the 2018 high at 1.4377 further up. Only a monthly close below 1.3000 negates. | ||
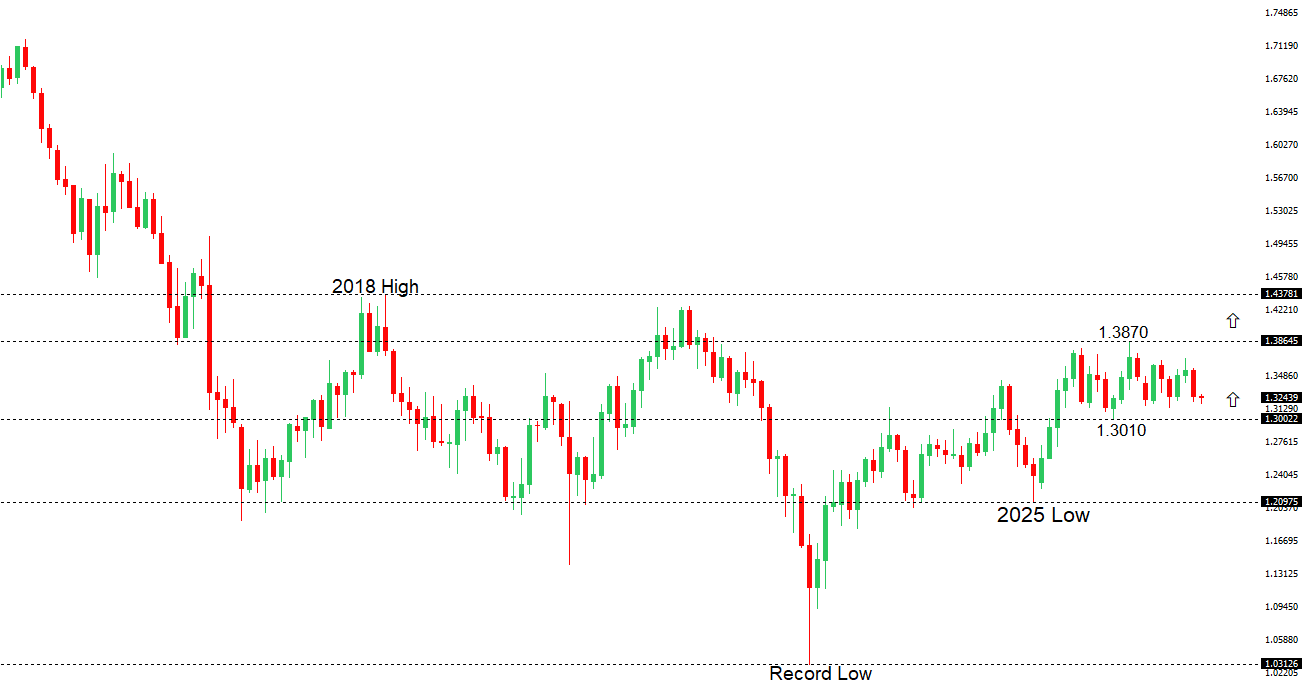 | ||
| R2 1.3407 - 17 September high - Medium R1 1.3312 - 30 September high - Medium S1 1.3181 - 1 October low - Medium S2 1.3140 - 24 June/2026 low - Strong | ||
| GBPUSD: fundamental overview | ||
| Sterling is caught between reassurance over fiscal discipline and concern about the growth impact of the upcoming UK budget. Reports that Chancellor John Healey will fund new measures through tax increases or spending cuts rather than extra borrowing could help steady gilt-market confidence and ease pressure on the pound. However, the prospect of further fiscal tightening also risks weighing on household spending and business activity, potentially giving the Bank of England more room to ease if inflation allows. The key question is whether the October budget can restore confidence in the public finances without undermining growth, while shifts in US rate expectations and broader risk sentiment remain important drivers of sterling against the dollar. | ||
| USDJPY: technical overview | ||
| The recent breakdown below 155.00 suggests the market could be on the verge of a bigger structural shift, with the possibility for an end to a longer-term uptrend and the start to a period of persistent weakness. Critical support now comes in the form of the 2026 low from January at 151.97, with a drop below to strengthen the bearish outlook and open the door for a major downside extension targeting the 2024 low at 139.58. The market would need to get back above 160.00 to take the immediate pressure off the downside. | ||
 | ||
| R2 159.04 - 24 September high - Strong R1 158.76 - 12 October high - Medium S1 156.37 - 30 September low - Medium S2 155.33 - 17 September low - Medium | ||
| USDJPY: fundamental overview | ||
| The yen remains under pressure as fading expectations for an October Bank of Japan rate hike reinforce the policy divergence with a Federal Reserve still widely expected to tighten further. Reports that BoJ officials favor pausing after September’s increase have weighed on the currency, while geopolitical tensions and elevated oil prices add pressure through Japan’s reliance on imported energy and renewed demand for the dollar. However, expectations for further Japanese policy normalization and the threat of official intervention are discouraging aggressive yen selling, keeping trading relatively contained. Attention now turns to US inflation data and Fed Chair Warsh’s upcoming remarks, with any disappointment in hawkish expectations potentially pulling US yields lower and offering the yen some relief. | ||
| AUDUSD: technical overview | ||
| There are signs of the formation of a longer-term base with the market recovering out from a meaningful longer-term support zone. The latest monthly close back above 0.7000 takes the big picture pressure off the downside and strengthens the case for a bottom, with the focus now on a push towards 0.8000. Setbacks should now be well supported ahead of 0.6700. | ||
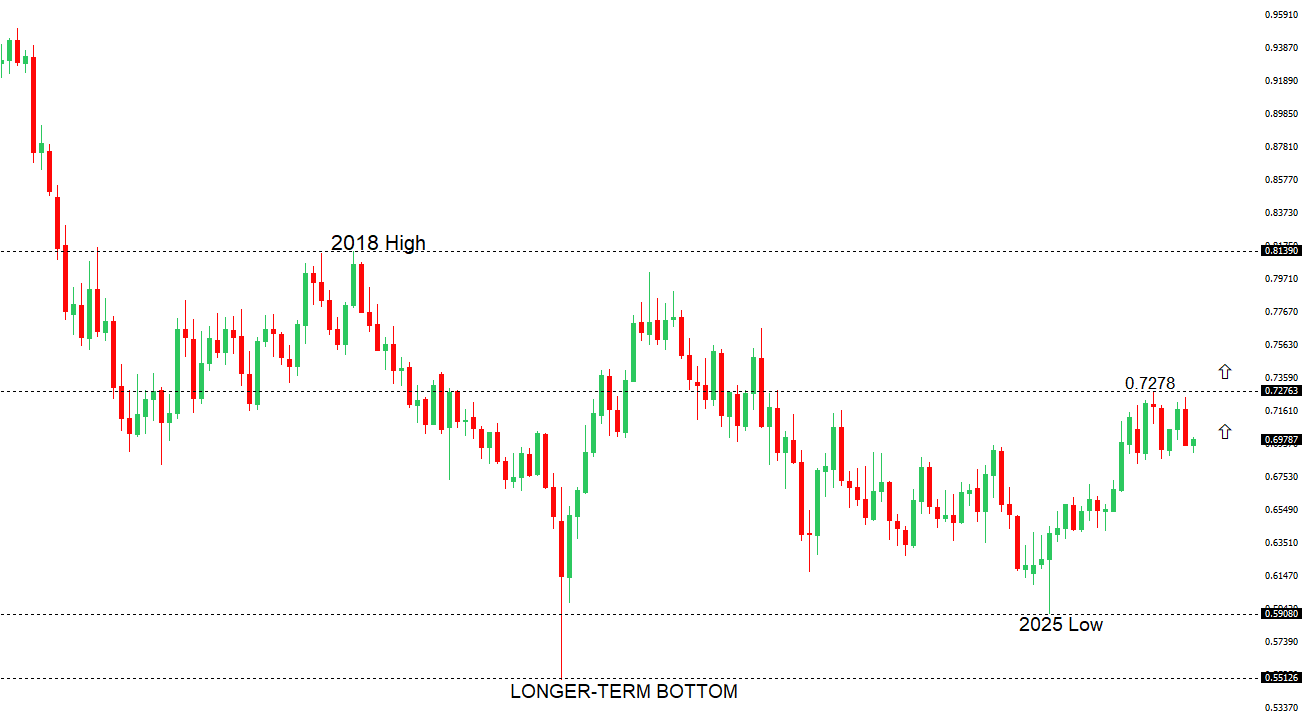 | ||
| R2 0.7142 - 15 September high - Strong R1 0.7046 - 24 September high - Medium S1 0.6933 - 8 October low - Medium S2 0.6904 - 1 October low - Strong | ||
| AUDUSD: fundamental overview | ||
| The Australian dollar is drawing support from stronger-than-expected Chinese trade figures, with robust growth in both exports and imports offering an encouraging signal for activity in Australia’s largest trading partner and demand for Australian commodities. Domestically, the RBA’s latest minutes highlight upside inflation risks from rising oil prices and AI-related demand, although signs of restrictive financial conditions and softer housing keep the policy outlook finely balanced. Meanwhile, Middle East tensions are tempering risk appetite, leaving the Aussie sensitive to shifts in broader market sentiment ahead of US inflation data, which could reshape Fed expectations and the direction of the US dollar. | ||
| Suggested reading | ||
| Why Midterm U.S. Elections Tend to Trend Bullish, Fisher Investments (October 10, 2026) High Interest Rates Could Be Here for a Good While, K. Pringle, Barron’s (October 10, 2026) | ||