


 | ||
| 13th October 2026 | view in browser | ||
| Caught between Silicon and the Strait | ||
| Markets head into Tuesday on the defensive as a technology selloff and energy-driven inflation fears weigh on equities, while softer Treasury yields temper dollar demand and support the yen and gold ahead of US earnings and inflation data. | ||
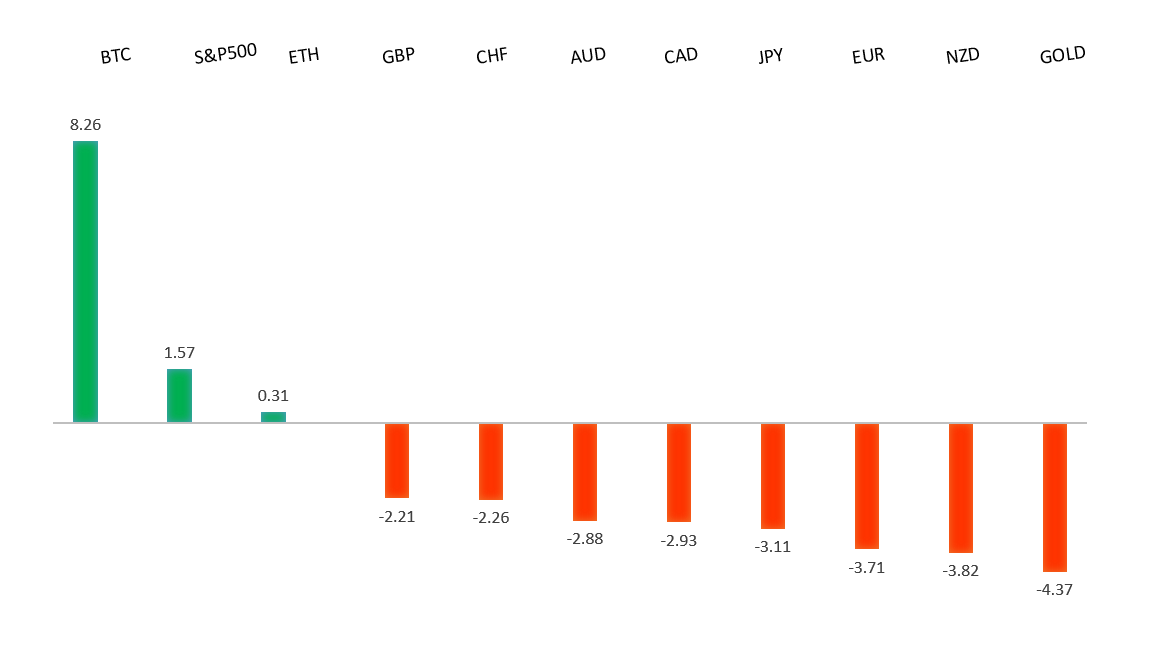
| Performance chart 30day v. USD (%) | ||
 | ||
| Technical & fundamental highlights | ||
| EURUSD: technical overview | ||
| The Euro continues to show signs of wanting to carve out a major bottom after trading down to a 20-year low in 2022. Setbacks should be exceptionally well supported above 1.1200 on a weekly close basis ahead of the next major upside extension back above 1.2000. | ||
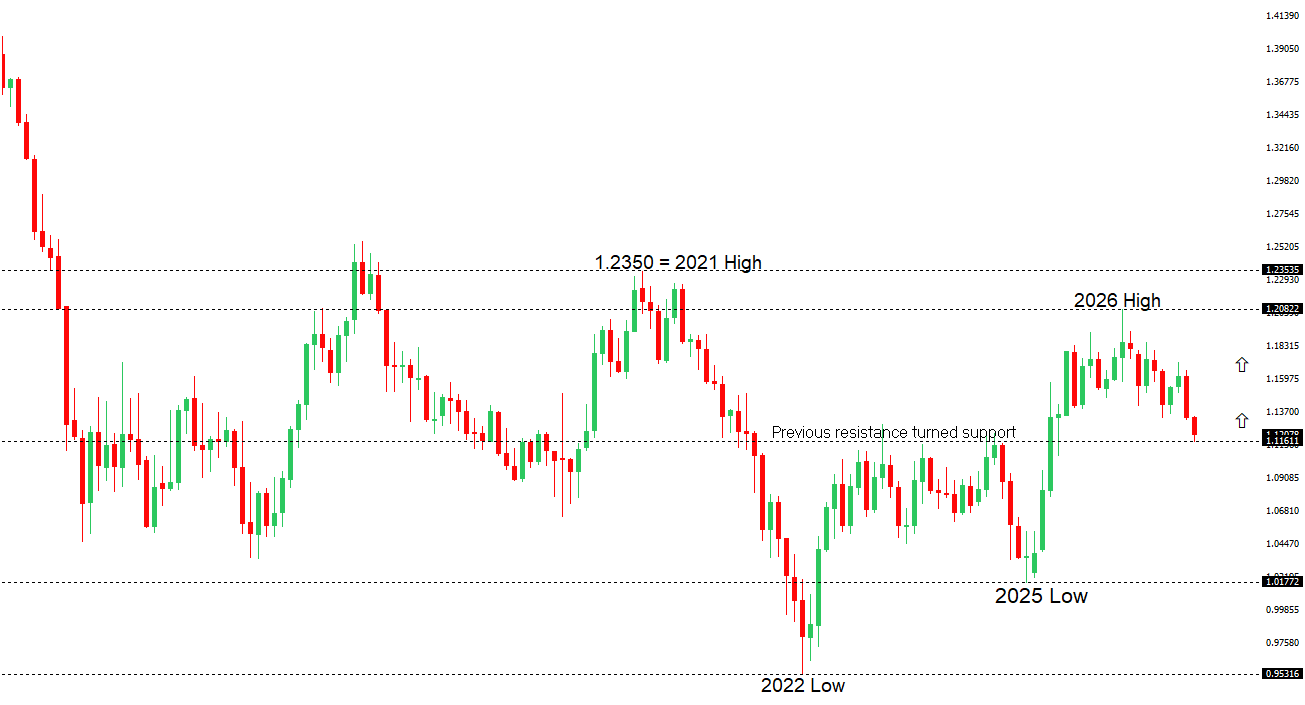 | ||
| R2 1.1337 - 1 October high - Medium R1 1.1286 - 2 October high - Medium S1 1.1152 - 13 Octoberber/2026 low - Strong S2 1.1100 - Figure - Strong | ||
| EURUSD: fundamental overview | ||
| The euro is holding modest gains against the dollar, but the fundamental backdrop remains challenging as hawkish Fed commentary and elevated US Treasury yields support demand for the greenback. Cleveland Fed President Beth Hammack’s warning that tighter policy may be needed to prevent inflation expectations becoming entrenched reinforces that headwind, with this week’s US inflation and retail sales releases set to shape the next move in rate expectations. On the European side, France’s budget standoff and doubts over the government’s ability to secure parliamentary backing for proposed savings are keeping fiscal and political risks in focus. Overall, the euro’s recovery remains vulnerable, with a more sustained improvement likely to require softer US data and some easing of French fiscal uncertainty. | ||
| GBPUSD: technical overview | ||
| The Pound remains exceptionally well supported on dips into the 1.3000 area, with the price largely consolidating above the psychological barrier and previous resistance turned support in the form of the 2023 high. Look for the market to continue be well supported on dips ahead of the next major upside extension through the yearly high at 1.3870 and towards a retest of the 2018 high at 1.4377 further up. Only a monthly close below 1.3000 negates. | ||
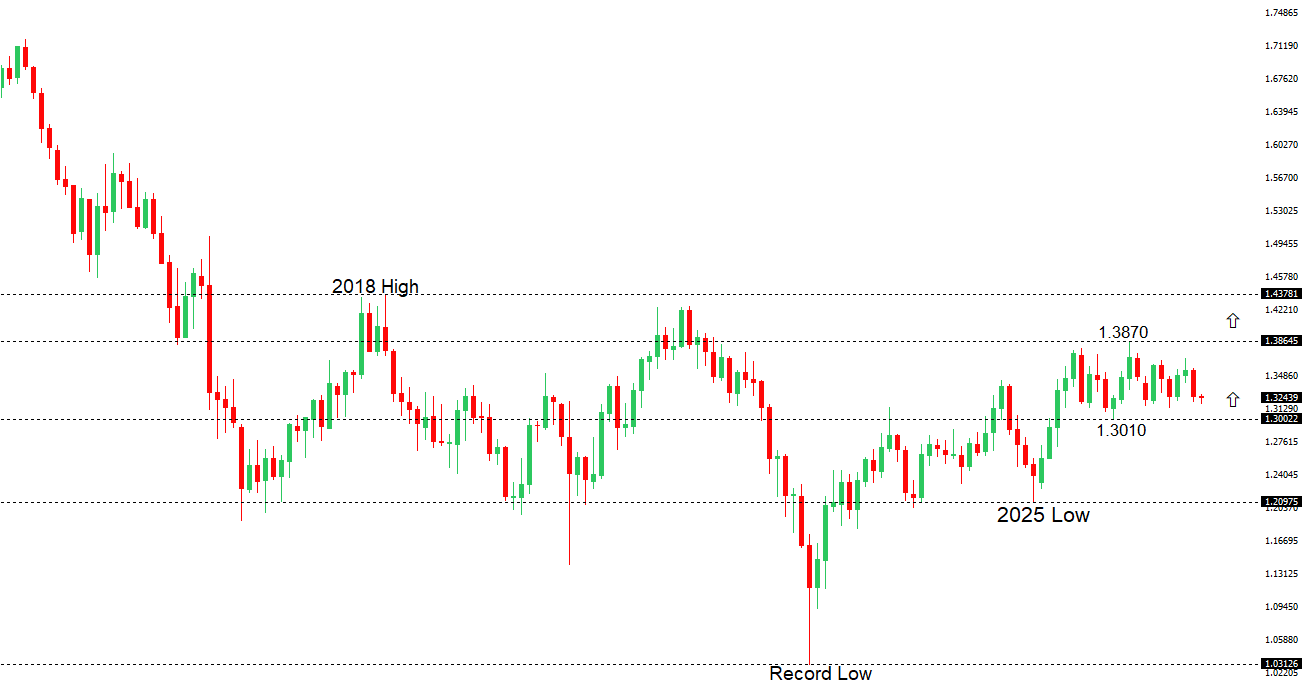 | ||
| R2 1.3407 - 17 September high - Medium R1 1.3312 - 30 September high - Medium S1 1.3181 - 1 October low - Medium S2 1.3140 - 24 June/2026 low - Strong | ||
| GBPUSD: fundamental overview | ||
| The pound is finding some support from stronger-than-expected BRC retail sales and hawkish comments from Bank of England policymaker Megan Greene, whose concerns about second-round inflation effects reinforce expectations that monetary policy will remain restrictive. Sterling is also benefiting from modest dollar profit-taking following the US currency’s recent advance. However, expectations of another Federal Reserve rate hike before year-end, alongside energy-related inflation risks and elevated US yields, continue to constrain the recovery. Persistent tensions involving Iran and renewed fighting in Yemen are also underpinning safe-haven dollar demand, leaving the pound’s near-term outlook dependent on upcoming UK growth figures, US inflation data and central bank guidance. | ||
| USDJPY: technical overview | ||
| The recent breakdown below 155.00 suggests the market could be on the verge of a bigger structural shift, with the possibility for an end to a longer-term uptrend and the start to a period of persistent weakness. Critical support now comes in the form of the 2026 low from January at 151.97, with a drop below to strengthen the bearish outlook and open the door for a major downside extension targeting the 2024 low at 139.58. The market would need to get back above 160.00 to take the immediate pressure off the downside. | ||
 | ||
| R2 159.04 - 24 September high - Strong R1 158.76 - 12 October high - Medium S1 156.37 - 30 September low - Medium S2 155.33 - 17 September low - Medium | ||
| USDJPY: fundamental overview | ||
| The yen is drawing support from caution over possible Japanese currency intervention and a modest pullback in the dollar, despite softer domestic wholesale inflation. The latest price data leave further Bank of Japan tightening on the table, but the easing in inflation pressure strengthens the case for an October pause and potentially delays the next hike until December. Elevated oil prices linked to Middle East tensions complicate that outlook by threatening renewed inflation while weighing on Japan’s energy import bill. Meanwhile, hawkish comments from the Fed’s Beth Hammack reinforce the prospect of restrictive US policy, limiting the yen’s recovery, with upcoming US inflation and retail sales reports set to shape interest rate expectations and the pair’s next direction. | ||
| AUDUSD: technical overview | ||
| There are signs of the formation of a longer-term base with the market recovering out from a meaningful longer-term support zone. The latest monthly close back above 0.7000 takes the big picture pressure off the downside and strengthens the case for a bottom, with the focus now on a push towards 0.8000. Setbacks should now be well supported ahead of 0.6700. | ||
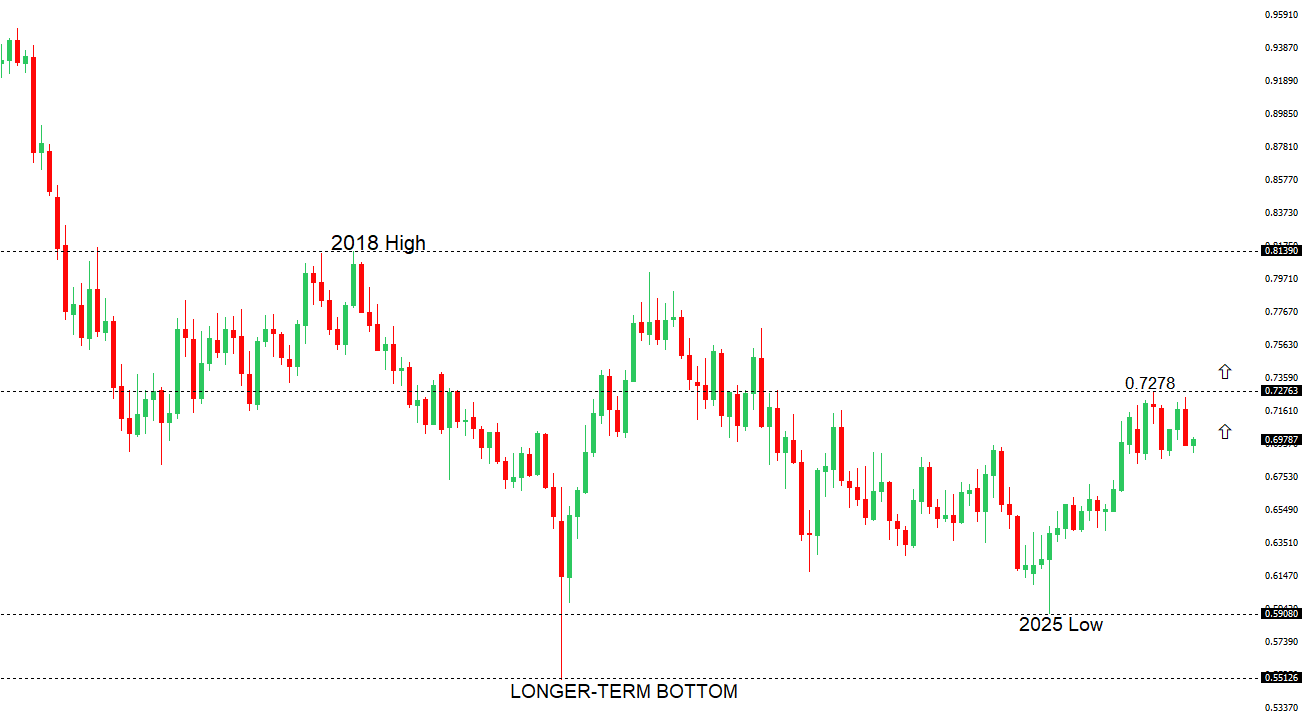 | ||
| R2 0.7142 - 15 September high - Strong R1 0.6996 - 12 October high - Medium S1 0.6904 - 1 October low - Medium S2 0.6865 - 30 June low - Strong | ||
| AUDUSD: fundamental overview | ||
| The Australian dollar is holding steady as the latest RBA minutes balance renewed upside inflation risks against signs of tighter domestic conditions. Policymakers flagged pressure from AI-related demand and higher oil prices, keeping a cautious stance on further easing, while weaker house prices and uncertainty around employment data complicate the assessment of how restrictive policy actually is. Externally, escalating Middle East tensions are weighing on risk appetite and supporting safe-haven dollar demand, limiting the Aussie’s upside. Attention now turns to US inflation data and Fed commentary, with softer readings potentially offering relief through reduced US rate expectations, while persistent price pressures would reinforce the dollar’s yield support. | ||
| Suggested reading | ||
| Remember What Does, Doesn’t Drive Bear Markets, Fisher Investments (October 10, 2026) How Long Can Above Average Stock-Market Returns Last?, C. Reilly, Grow Or Die (October 6, 2026) | ||