


 | ||
| 23rd October 2026 | view in browser | ||
| When chips crack and crude won’t | ||
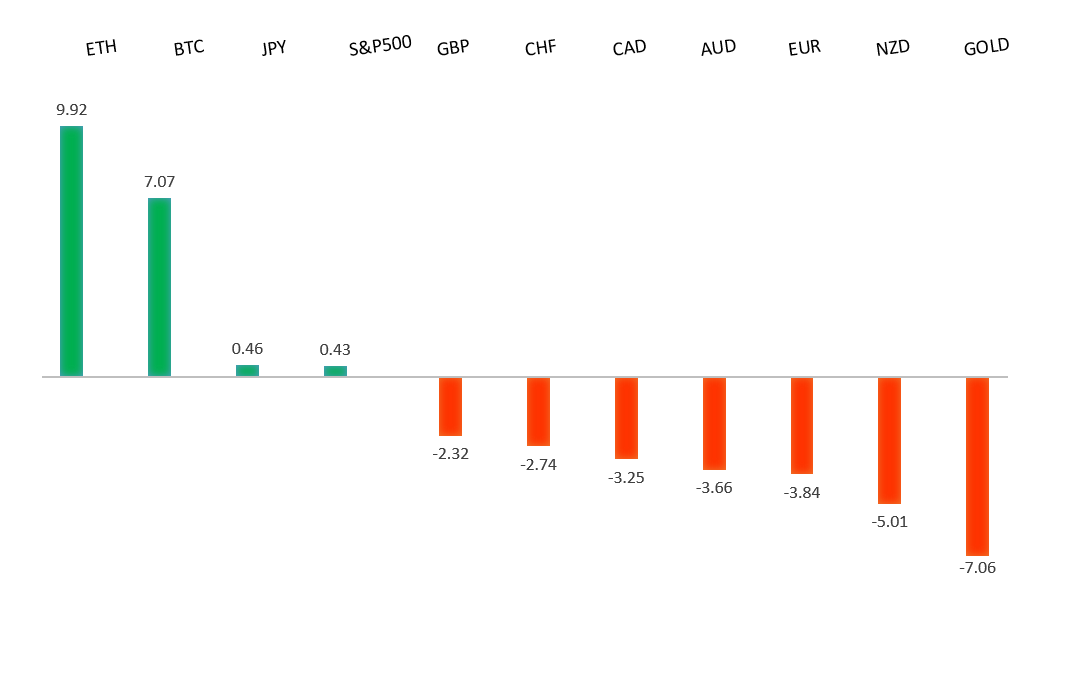
| Markets head into Friday caught between a deepening technology selloff and stubborn energy inflation, leaving investors cautious ahead of a pivotal week of central bank decisions. | ||
| Performance chart 30day v. USD (%) | ||
 | ||
| Technical & fundamental highlights | ||
| EURUSD: technical overview | ||
| The Euro continues to show signs of wanting to carve out a major bottom after trading down to a 20-year low in 2022. Setbacks should be exceptionally well supported above 1.1000 on a weekly close basis ahead of the next major upside extension back above 1.2000. | ||
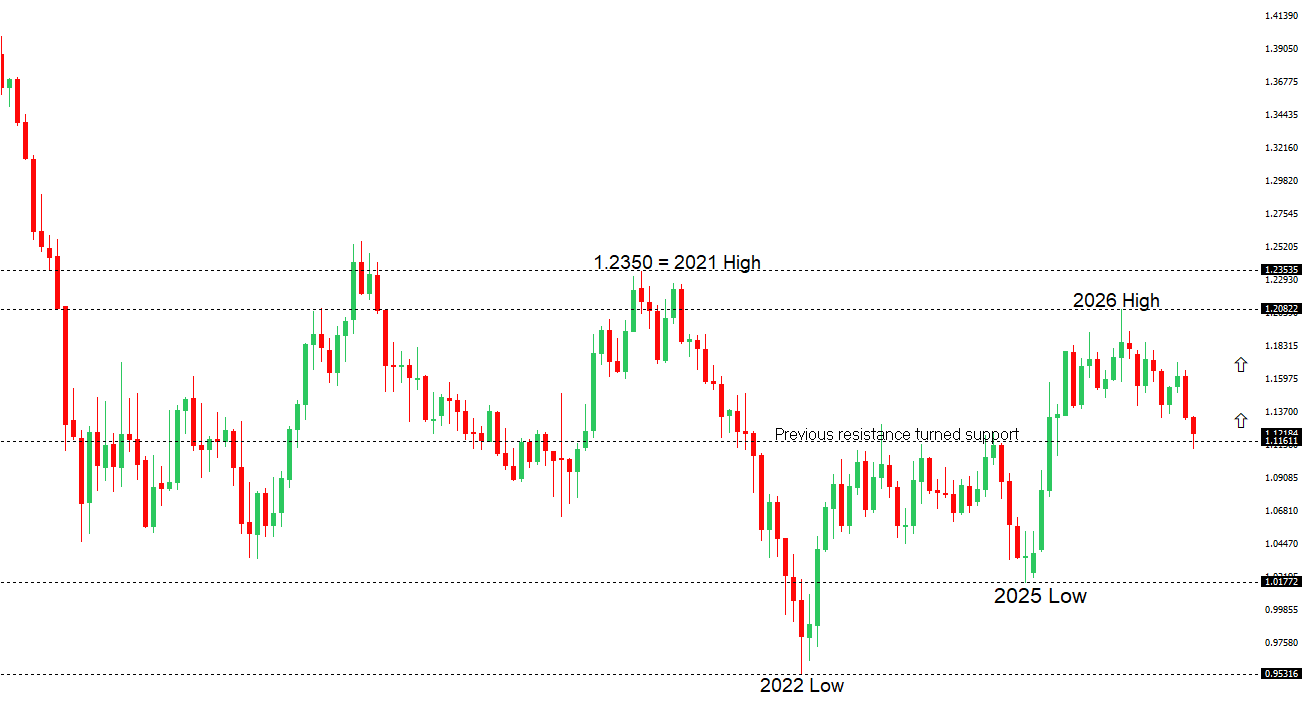 | ||
| R2 1.1337 - 1 October high - Medium R1 1.1270 - 16 October high - Medium S1 1.1181 - 19 Octoberber low - Medium S2 1.1113 - 14 Octoberber/2026 low - Strong | ||
| EURUSD: fundamental overview | ||
| The euro is drawing support from broad dollar weakness as falling US Treasury yields and expectations for the Fed to hold rates steady at its upcoming meeting reduce the dollar’s appeal. A rotation out of technology stocks into government bonds has reinforced that move, although persistent US inflation concerns and the prospect of further tightening later in the year could limit its momentum. France’s fiscal and political strains remain a drag on the euro, while Middle East tensions and volatile energy prices threaten the region’s growth outlook and could revive safe-haven dollar demand. Attention now turns to eurozone and US flash PMIs for fresh signals on relative economic strength, ahead of next week’s central bank decisions and key US growth and inflation releases. | ||
| GBPUSD: technical overview | ||
| The Pound remains exceptionally well supported on dips into the 1.3000 area, with the price largely consolidating above the psychological barrier and previous resistance turned support in the form of the 2023 high. Look for the market to continue be well supported on dips ahead of the next major upside extension through the yearly high at 1.3870 and towards a retest of the 2018 high at 1.4377 further up. Only a monthly close below 1.3000 negates. | ||
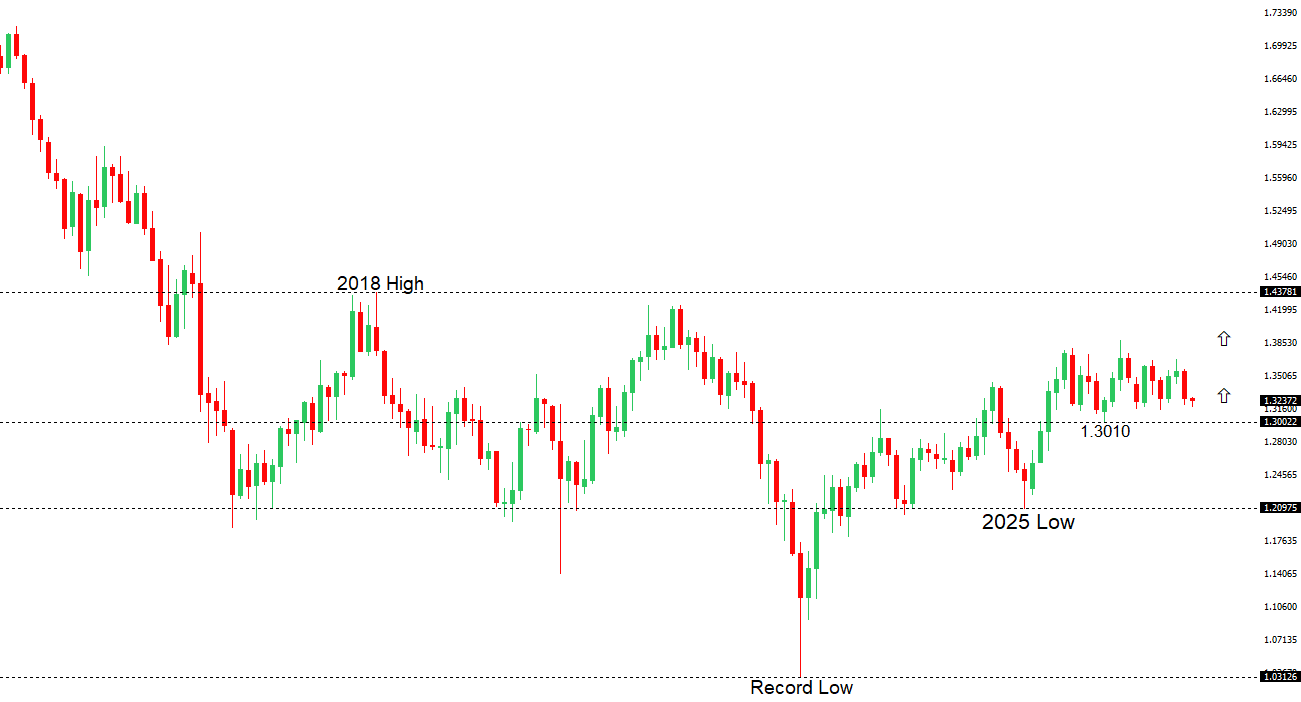 | ||
| R2 1.3498 - 16 September high - Medium R1 1.3420 - 22 October high - Medium S1 1.3297 - 20 October low - Medium S2 1.3137 - 14 October/2026 low - Strong | ||
| GBPUSD: fundamental overview | ||
| The pound remains supported by a hotter UK inflation backdrop, with stronger headline and core readings reinforcing expectations for a Bank of England rate hike in November and potentially further tightening in December. Persistent wage pressures and concerns about second-round inflation effects are strengthening the case for a more restrictive policy stance, helping preserve sterling’s yield appeal. Relative euro weakness has also supported the pound against the single currency, while expectations that the Federal Reserve will hold rates steady this month have provided some breathing room against the dollar. Attention now turns to UK retail sales for evidence of consumer resilience, with next week’s budget also in focus; however, expectations for renewed Fed tightening in December could limit further gains in GBPUSD. | ||
| USDJPY: technical overview | ||
| The recent breakdown below 155.00 suggests the market could be on the verge of a bigger structural shift, with the possibility for an end to a longer-term uptrend and the start to a period of persistent weakness. Critical support now comes in the form of the 2026 low from January at 151.97, with a drop below to strengthen the bearish outlook and open the door for a major downside extension targeting the 2024 low at 139.58. The market would need to get back above 160.00 to take the immediate pressure off the downside. | ||
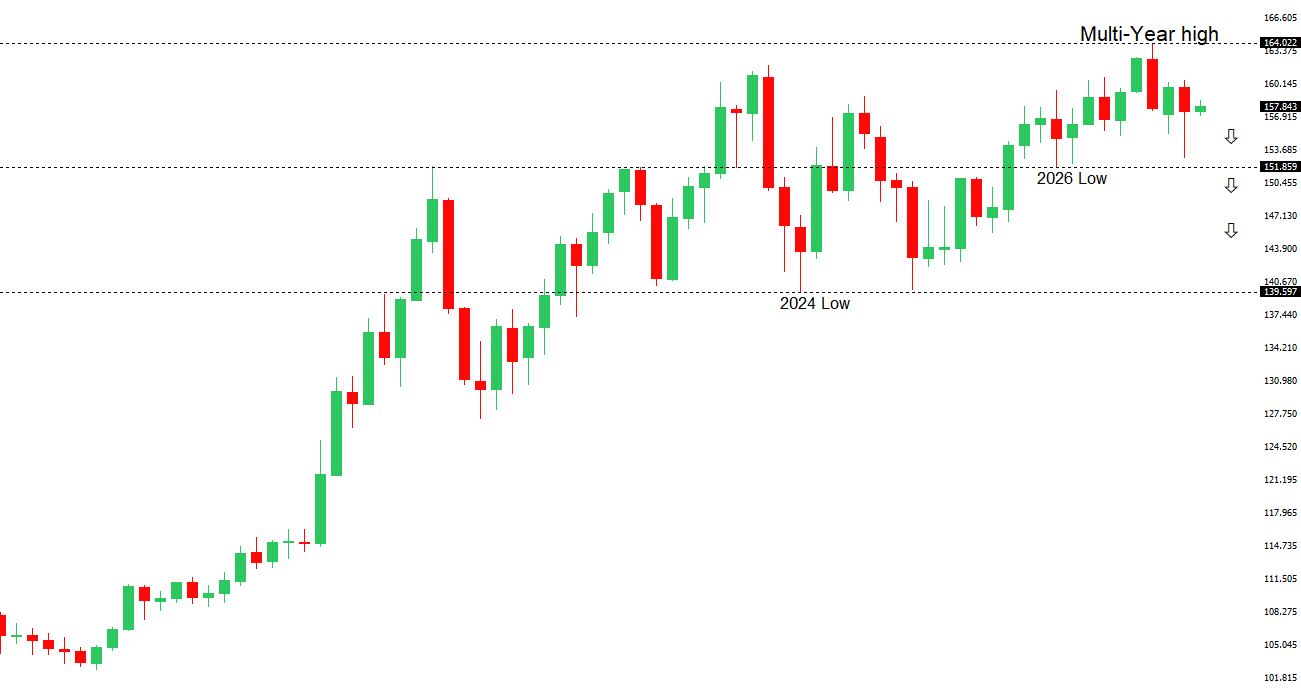 | ||
| R2 159.04 - 24 September high - Strong R1 158.26 - 22 October high - Medium S1 156.07 - 23 October low - Medium S2 155.29 - 4 September low - Strong | ||
| USDJPY: fundamental overview | ||
| The yen is navigating uncertainty over Japan’s progress toward sustained inflation, with Economy Minister Kiuchi saying conditions are still insufficient for the government to officially declare an end to deflation. His comments highlight the distinction between rising prices and confidence that inflation can endure, reinforcing caution around the pace of Bank of Japan policy normalization. The government will assess consumer prices, the GDP deflator, and the underlying drivers of inflation, while emphasizing coordination with the BoJ to achieve stable, sustainable price growth. For the yen, the implication is that further policy tightening remains dependent on convincing evidence of durable inflation, limiting support from expectations of higher Japanese interest rates. | ||
| AUDUSD: technical overview | ||
| There are signs of the formation of a longer-term base with the market recovering out from a meaningful longer-term support zone. The latest monthly close back above 0.7000 takes the big picture pressure off the downside and strengthens the case for a bottom, with the focus now on a push towards 0.8000. Setbacks should now be well supported ahead of 0.6700. | ||
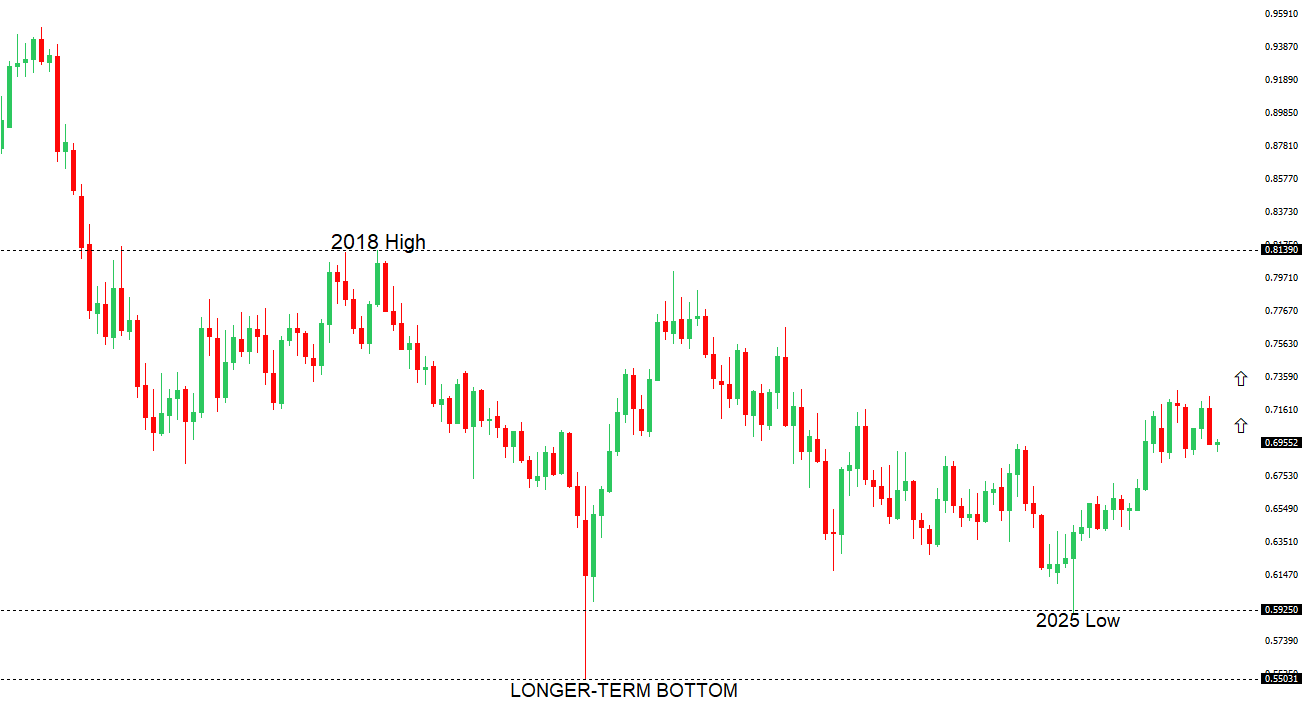 | ||
| R2 0.7046 - 24 September high - Strong R1 0.7037 - 22 October high - Medium S1 0.6970 - 20 October low - Medium S2 0.6894 - 15 October low - Strong | ||
| AUDUSD: fundamental overview | ||
| The Australian dollar remains supported near its monthly high as hawkish RBA commentary keeps expectations for another rate hike alive. Deputy Governor Hauser’s warning that underlying inflation could exceed forecasts, alongside Christopher Kent’s suggestion that neutral interest rates are rising, has reinforced the prospect of further tightening. Better-than-expected Chinese growth has added support given Australia’s close trade ties with China. However, a modest US dollar recovery, oil-related inflation concerns, and Middle East tensions are limiting further gains. Attention now turns to next week’s Fed decision and US growth and inflation releases, which could reshape US rate expectations and determine whether the Aussie’s recent advance extends. | ||
| Suggested reading | ||
| The End of Abundance, V. Nageswaran, Project Syndicate (October 19, 2026) The French Revolution’s disastrous money experiment, R. Wigglesworth, Financial Times (October 21, 2026) | ||