


 | ||
| 9th November 2026 | view in browser | ||
| Relief rally contends with payrolls problem | ||
| Equities are finding their footing into Monday as tech rebounds, while strong US jobs data keeps a December Fed hike in view and mixed signals on Iran keep oil volatile. | ||
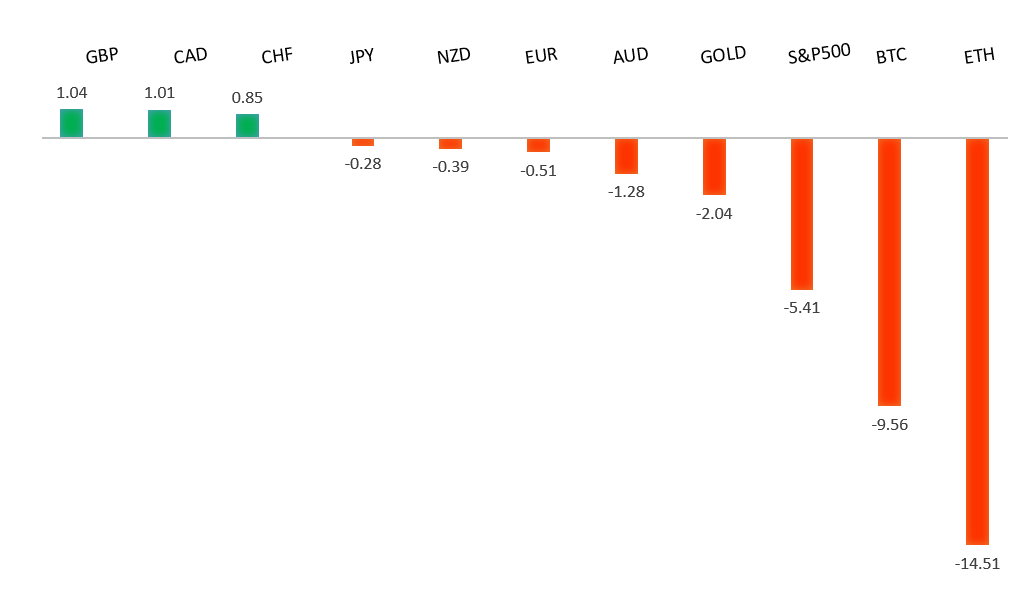
| Performance chart 30day v. USD (%) | ||
 | ||
| Technical & fundamental highlights | ||
| EURUSD: technical overview | ||
| The Euro continues to show signs of wanting to carve out a major bottom after trading down to a 20-year low in 2022. Setbacks should be exceptionally well supported above 1.1000 on a weekly close basis ahead of the next major upside extension back above 1.2000. | ||
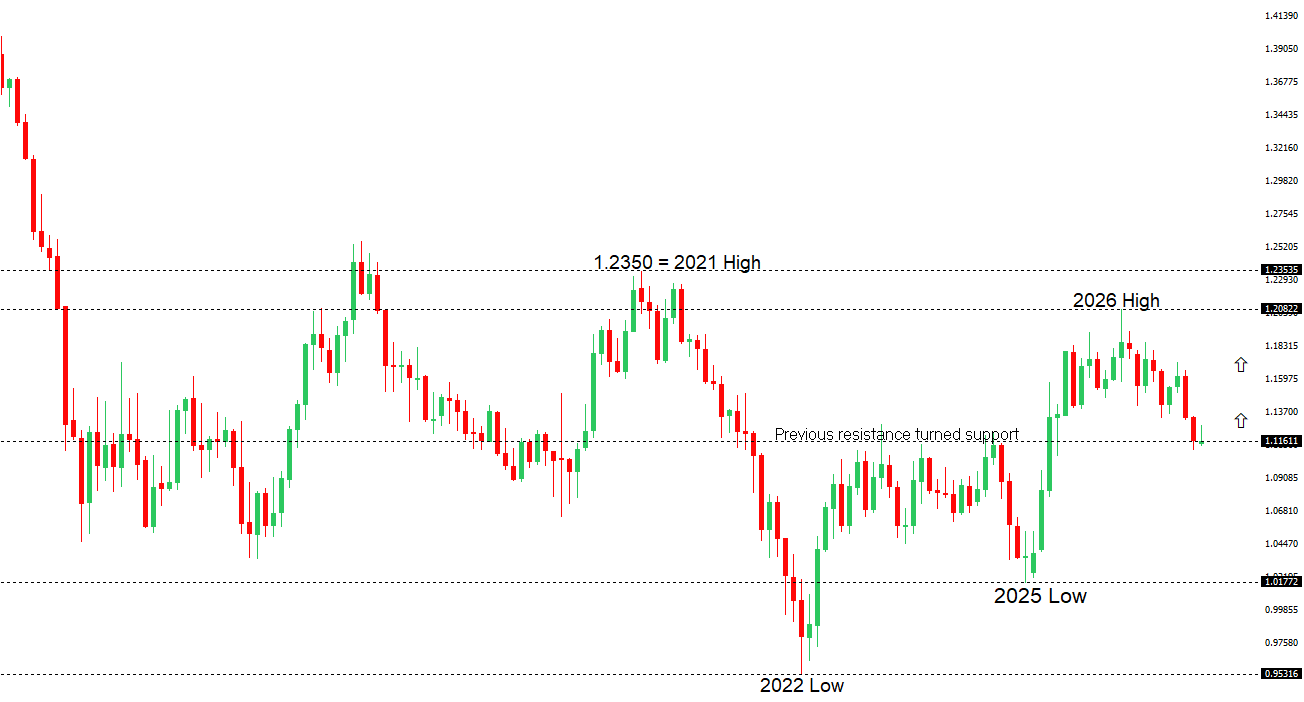 | ||
| R2 1.1337 - 1 October high - Medium R1 1.1274 - 4 November high - Medium S1 1.1131 - 6 November low - Medium S2 1.1104 - 29 October/2026 low - Strong | ||
| EURUSD: fundamental overview | ||
| The euro is firmer against the dollar as rising inflation and more hawkish ECB commentary bring a December rate hike into sharper focus. Higher energy costs pushed eurozone inflation to 4% in October, and remarks from the German and Italian central bank governors reinforced the case for further tightening, though ECB President Christine Lagarde has kept the decision tied to incoming data. A softer dollar has helped the euro recover, but stronger-than-expected US payrolls and a dip in unemployment keep a December Fed hike firmly in play. This week’s US inflation releases are the next test for the rally, with an upside surprise likely to lend the dollar fresh support. | ||
| GBPUSD: technical overview | ||
| The Pound remains exceptionally well supported on dips into the 1.3000 area, with the price largely consolidating above the psychological barrier and previous resistance turned support in the form of the 2023 high. Look for the market to continue be well supported on dips ahead of the next major upside extension through the yearly high at 1.3870 and towards a retest of the 2018 high at 1.4377 further up. Only a monthly close below 1.3000 negates. | ||
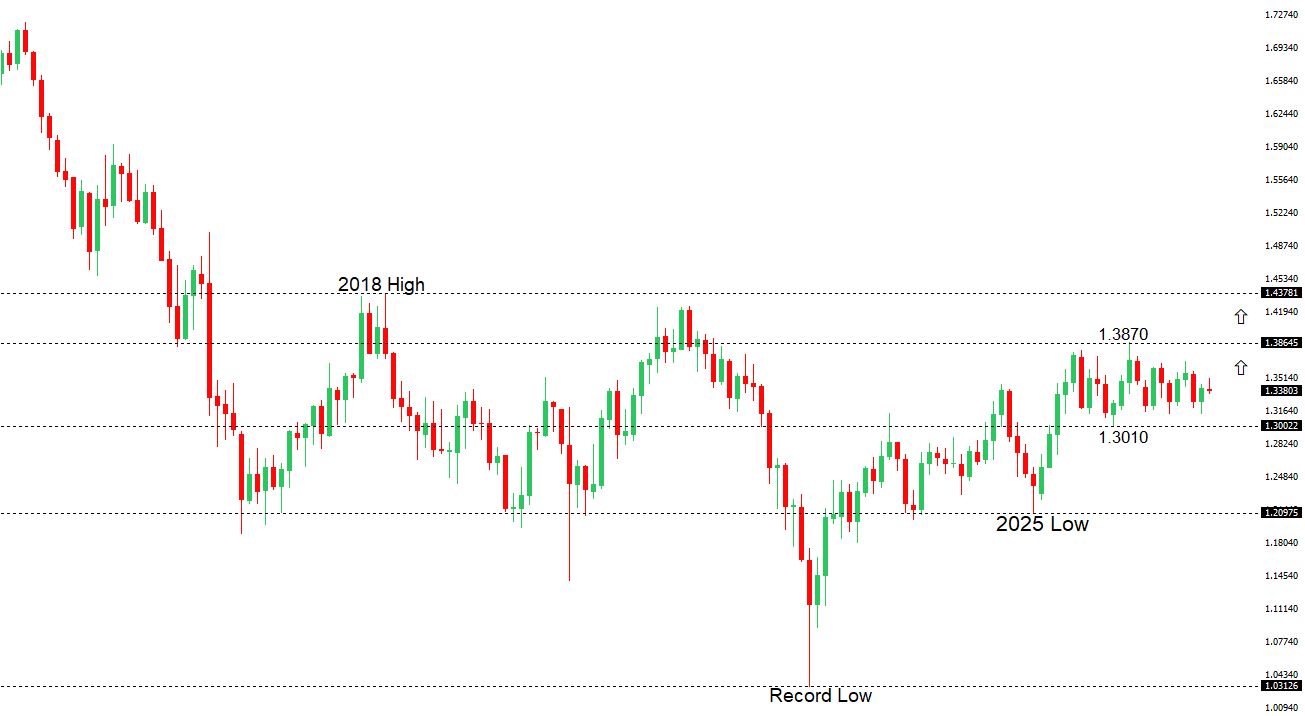 | ||
| R2 1.3568 - 9 September high - Medium R1 1.3504 - 4 November high - Medium S1 1.3342 - 6 November low - Medium S2 1.3272 - 28 October low - Strong | ||
| GBPUSD: fundamental overview | ||
| Sterling edged higher at the start of the week as the Bank of England’s hawkish rate hike continued to lend support. With higher energy prices keeping inflation risks elevated, markets are pricing in three more BoE hikes by the end of next year. Chief Economist Huw Pill struck a more cautious tone, though, leaving room for the Bank to hold or even cut rates if growth stalls. On the US side, stronger-than-expected payrolls and a lower unemployment rate reinforced expectations for a December Fed hike, keeping the dollar supported and limiting the pound’s rebound. | ||
| USDJPY: technical overview | ||
| The recent breakdown below 155.00 suggests the market could be on the verge of a bigger structural shift, with the possibility for an end to a longer-term uptrend and the start to a period of persistent weakness. Critical support now comes in the form of the 2026 low from January at 151.97, with a drop below to strengthen the bearish outlook and open the door for a major downside extension targeting the 2024 low at 139.58. The market would need to get back above 160.00 to take the immediate pressure off the downside. | ||
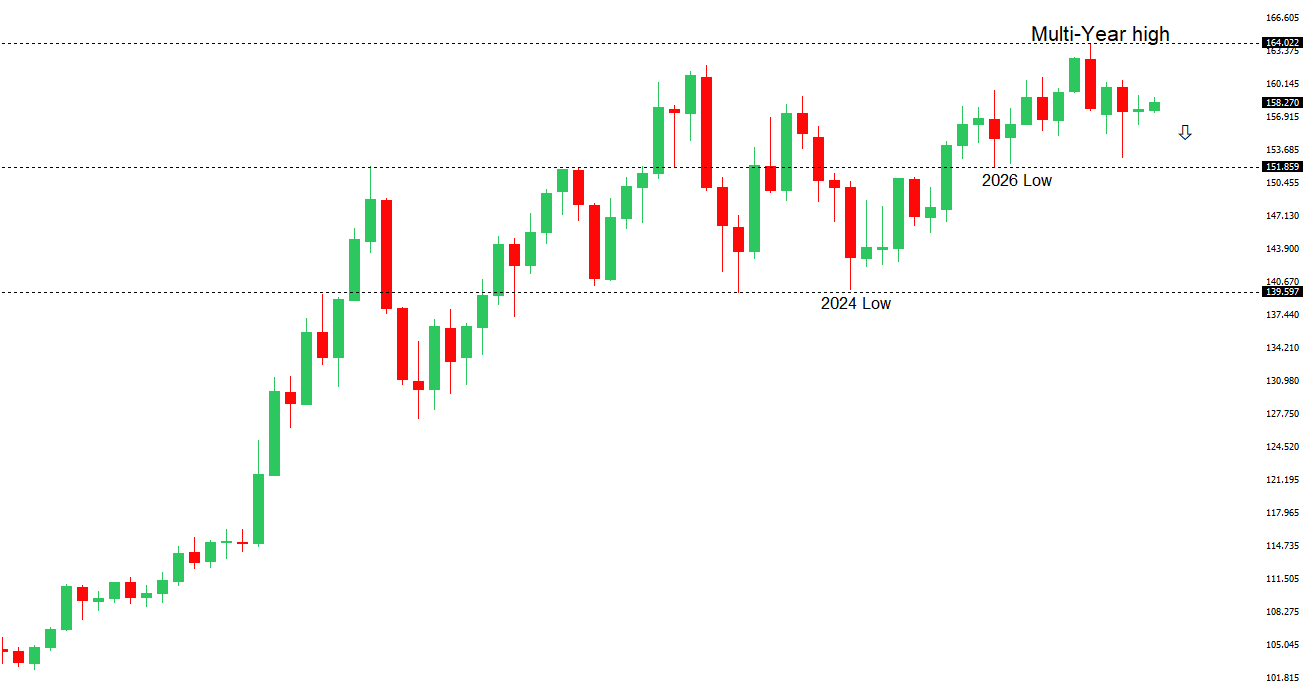 | ||
| R2 159.04 - 24 September high - Strong R1 158.77 - 3 November high - Medium S1 156.96 - 30 October low - Medium S2 156.07 - 23 October low - Strong | ||
| USDJPY: fundamental overview | ||
| The yen firmed against the dollar early Monday as the Bank of Japan’s September minutes reinforced expectations for a December rate hike. The BoJ held rates steady in October, but the minutes showed broad agreement that further tightening would be appropriate as underlying inflation approaches target. The yen also benefited from safe-haven demand during the recent equity selloff, when falling Treasury yields dulled the dollar’s appeal. The main counterweight is US monetary policy. Stronger-than-expected October payrolls, a lower unemployment rate and San Francisco Fed President Mary Daly’s emphasis on persistent inflation have strengthened the case for a December Fed hike, limiting the scope for further yen gains. | ||
| AUDUSD: technical overview | ||
| There are signs of the formation of a longer-term base with the market recovering out from a meaningful longer-term support zone. The latest monthly close back above 0.7000 takes the big picture pressure off the downside and strengthens the case for a bottom, with the focus now on a push towards 0.8000. Setbacks should now be well supported ahead of 0.6700. | ||
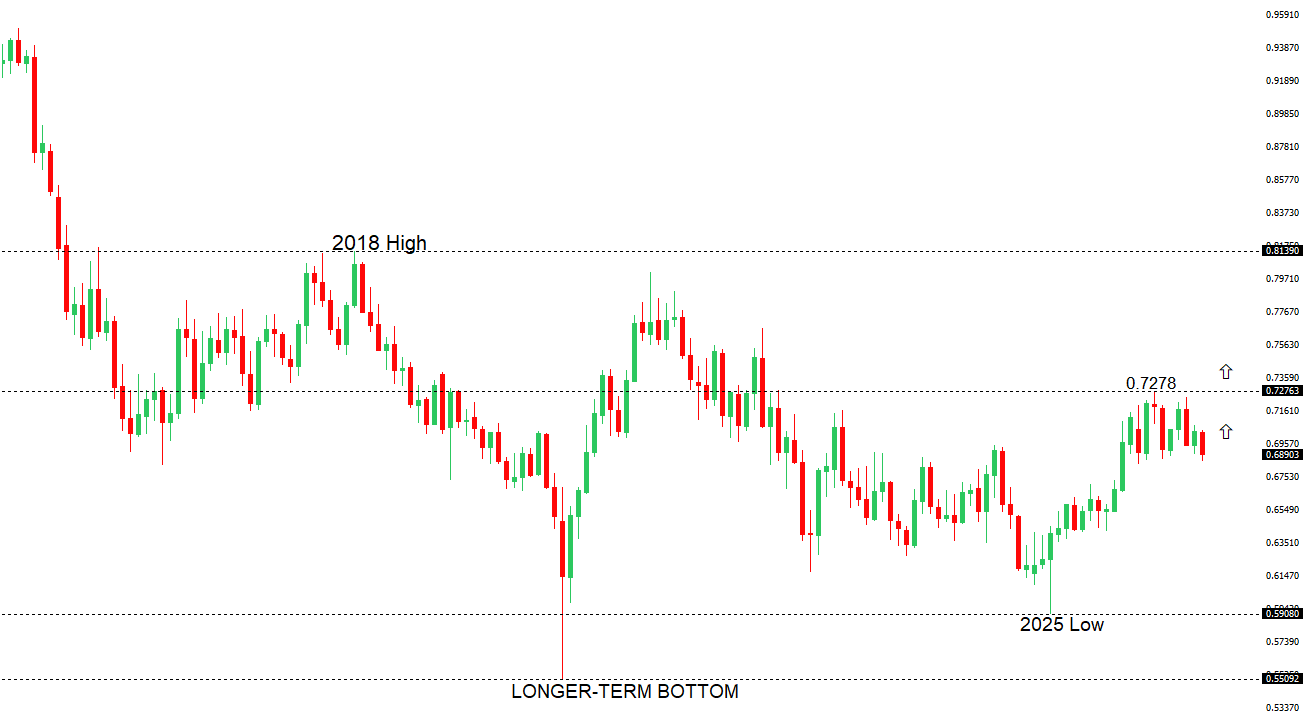 | ||
| R2 0.7000 - Psychological - Medium R1 0.6943 - 6 November high - Medium S1 0.6854 - 6 November low - Medium S2 0.6833 - 3 March low - Strong | ||
| AUDUSD: fundamental overview | ||
| The Australian dollar is firmer as China’s decision to extend its tariff reprieve on US imports lifts risk appetite ahead of the expected Trump–Xi meeting at APEC. Beijing is keeping its existing tariffs in place, but the extension eases the immediate risk of a renewed trade escalation, a welcome development for the Aussie given Australia’s exposure to Chinese demand. At home, the RBA’s latest rate hike has offered limited support, with a split vote and cautious guidance leaving the door open to a December pause even as inflation remains above target. For now, the improvement in global risk sentiment is doing more to lift the Aussie than expectations for further domestic tightening. | ||
| Suggested reading | ||
| Dot-Com Lessons for the AI Bubble, C. Onwurah, Project Syndicate (November 4, 2026) 5 Things to Tackle Before 2027, C. Benz, Morningstar (November 6, 2026) | ||