


 | ||
| 6th November 2026 | view in browser | ||
| Payrolls inherit a fractured market | ||
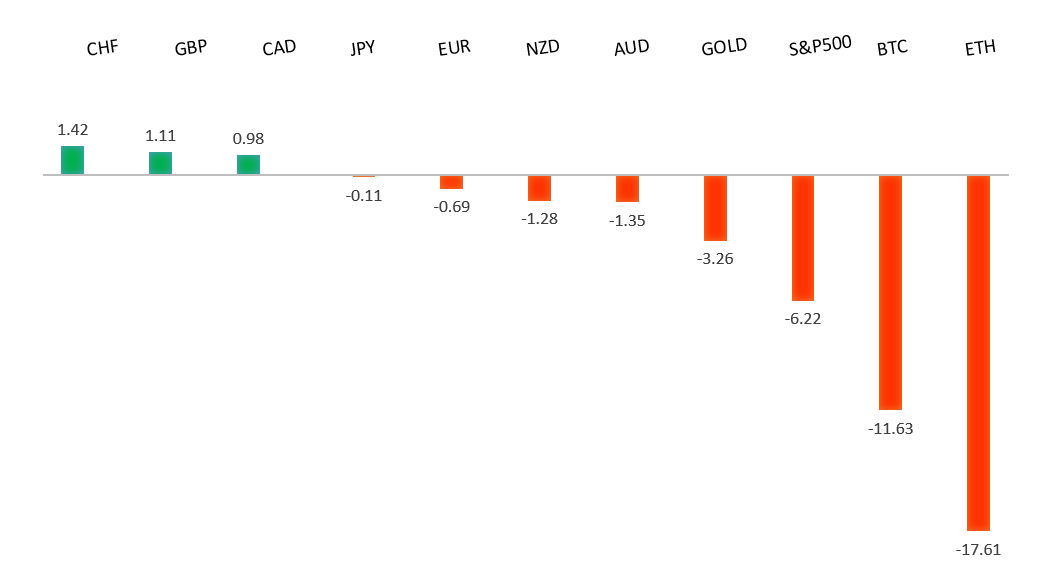
| Friday’s US jobs report will test whether Wall Street’s tentative rebound can hold after an AI-led selloff sent investors into Treasuries and left the dollar caught between haven demand and lower yields. | ||
| Performance chart 30day v. USD (%) | ||
 | ||
| Technical & fundamental highlights | ||
| EURUSD: technical overview | ||
| The Euro continues to show signs of wanting to carve out a major bottom after trading down to a 20-year low in 2022. Setbacks should be exceptionally well supported above 1.1000 on a weekly close basis ahead of the next major upside extension back above 1.2000. | ||
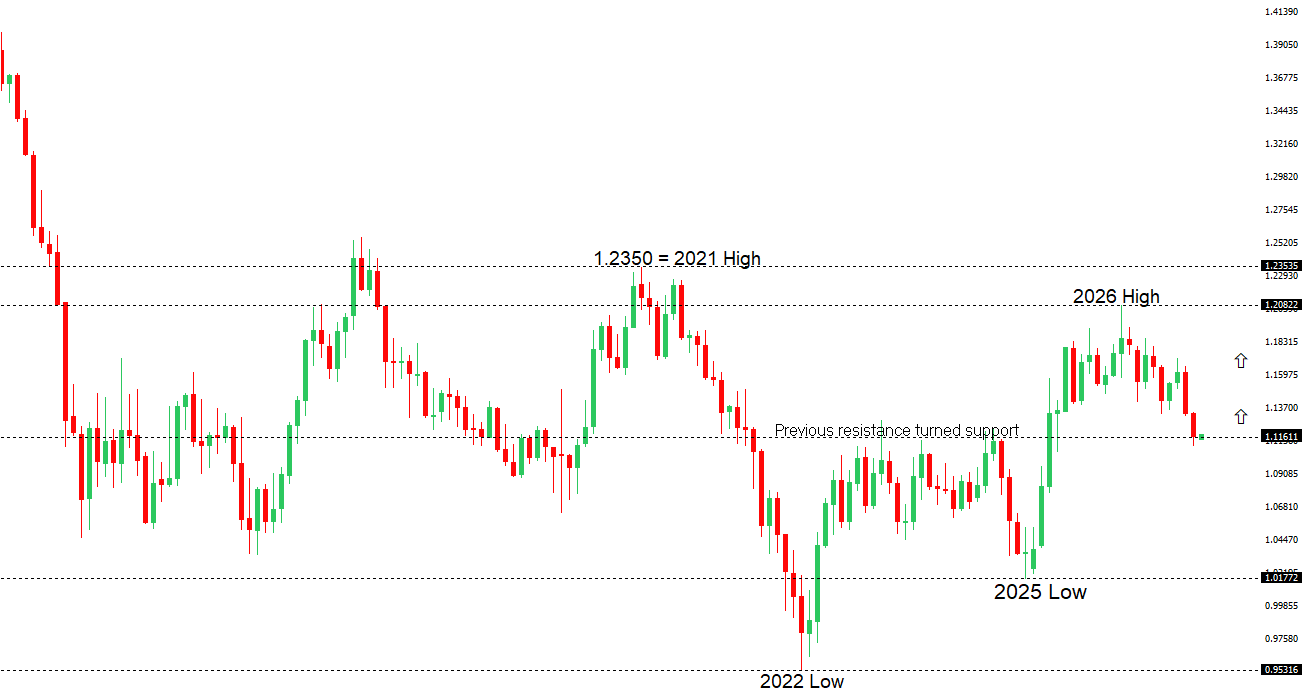 | ||
| R2 1.1337 - 1 October high - Medium R1 1.1274 - 4 November high - Medium S1 1.1136 - 30 October low - Medium S2 1.1104 - 29 October/2026 low - Strong | ||
| EURUSD: fundamental overview | ||
| The euro slipped below $1.12 early Friday as a global selloff in AI stocks revived safe-haven demand for the dollar. That bid has come even as markets pared back expectations for a December Fed hike following the US midterms. On the euro side, headline inflation rose to 4.0% in October while core inflation held at 2.5%, and ECB President Christine Lagarde’s emphasis on persistent inflation risks has helped cushion the downside. Lingering tariff uncertainty and a pullback in eurozone yields have tempered that support. German industrial production and eurozone retail sales are the next tests for the region’s growth outlook, though US payrolls are likely to have the bigger influence on EURUSD through their impact on Fed expectations. | ||
| GBPUSD: technical overview | ||
| The Pound remains exceptionally well supported on dips into the 1.3000 area, with the price largely consolidating above the psychological barrier and previous resistance turned support in the form of the 2023 high. Look for the market to continue be well supported on dips ahead of the next major upside extension through the yearly high at 1.3870 and towards a retest of the 2018 high at 1.4377 further up. Only a monthly close below 1.3000 negates. | ||
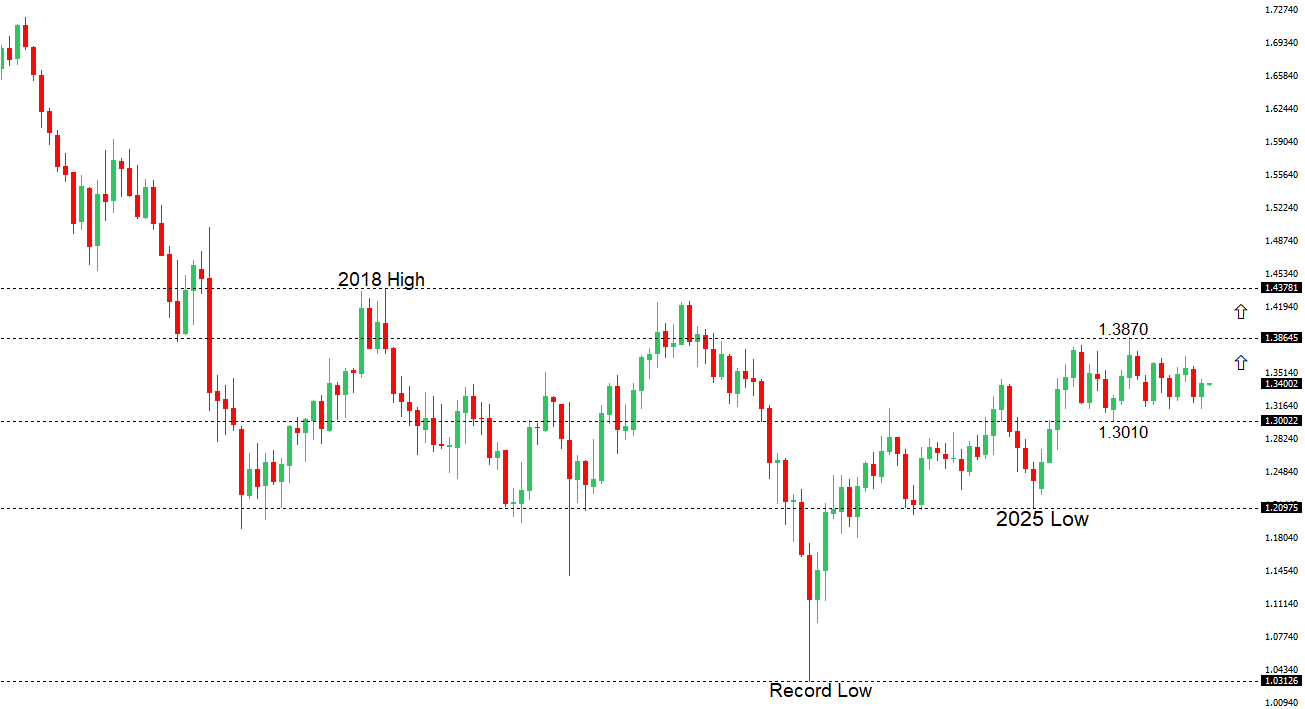 | ||
| R2 1.3568 - 9 September high - Medium R1 1.3504 - 4 November high - Medium S1 1.3396 - 3 November low - Medium S2 1.3371 - 30 October low - Medium | ||
| GBPUSD: fundamental overview | ||
| Sterling has steadied against the dollar ahead of U.S. payrolls, with the Bank of England’s rate hike and its signal that another increase may be needed continuing to underpin the pound. The UK’s autumn budget has also helped ease near-term fiscal concerns. On the dollar side, hopes for diplomacy with Iran have pushed oil prices lower, easing inflation concerns and helping pull Treasury yields down, while the prospect of gridlock after the U.S. midterms has tempered expectations for fresh fiscal stimulus. A softer payrolls print could reinforce the decline in yields and support sterling, while a stronger report could lift the dollar by firming expectations for a December Fed hike. | ||
| USDJPY: technical overview | ||
| The recent breakdown below 155.00 suggests the market could be on the verge of a bigger structural shift, with the possibility for an end to a longer-term uptrend and the start to a period of persistent weakness. Critical support now comes in the form of the 2026 low from January at 151.97, with a drop below to strengthen the bearish outlook and open the door for a major downside extension targeting the 2024 low at 139.58. The market would need to get back above 160.00 to take the immediate pressure off the downside. | ||
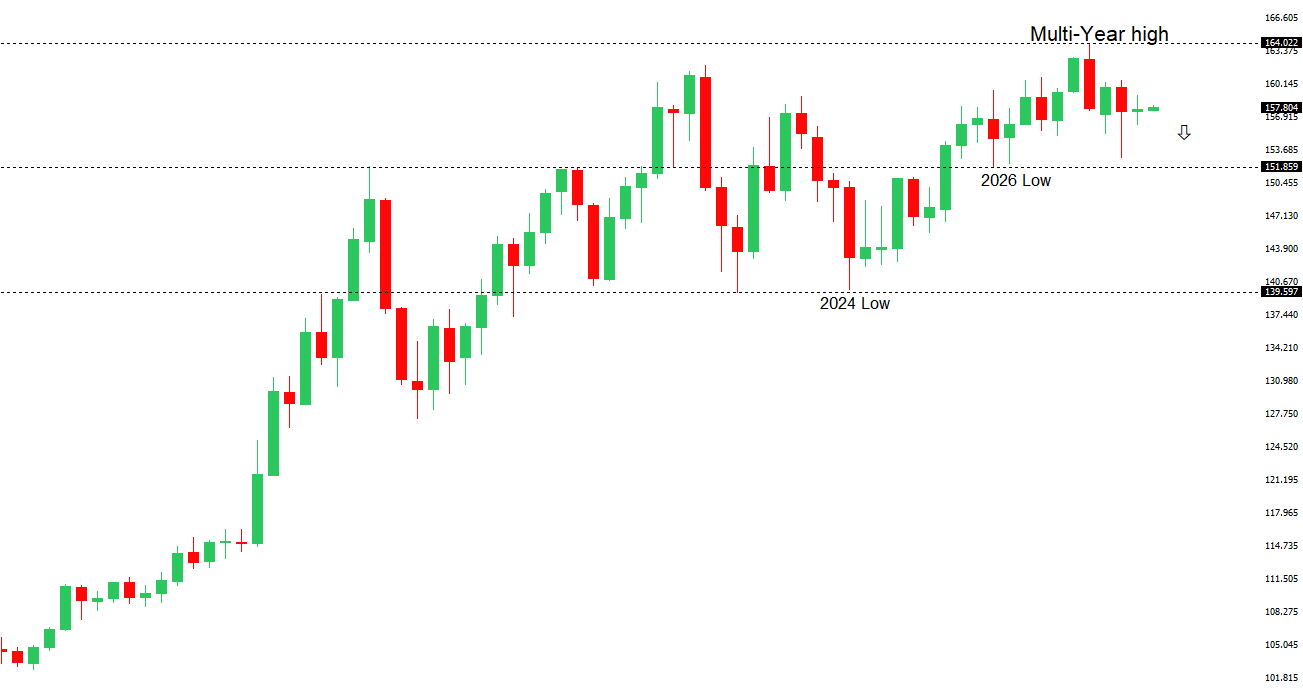 | ||
| R2 159.04 - 24 September high - Strong R1 158.77 - 3 November high - Medium S1 156.96 - 30 October low - Medium S2 156.07 - 23 October low - Strong | ||
| USDJPY: fundamental overview | ||
| The yen has slipped from a weekly high against the dollar as traders adjust positions ahead of Friday’s US payrolls report. The dollar’s rebound has been modest, with hopes for diplomacy with Iran driving oil prices lower, easing inflation concerns and prompting markets to trim bets on a December Fed hike. A selloff on Wall Street also pushed Treasury yields lower, narrowing the US yield advantage. Meanwhile, the Bank of Japan’s latest minutes reinforced expectations of a December hike, giving the yen some support. A strong payrolls print could revive Fed hike bets and lift USDJPY, while a softer reading could push US yields lower and put the yen back on the front foot. | ||
| AUDUSD: technical overview | ||
| There are signs of the formation of a longer-term base with the market recovering out from a meaningful longer-term support zone. The latest monthly close back above 0.7000 takes the big picture pressure off the downside and strengthens the case for a bottom, with the focus now on a push towards 0.8000. Setbacks should now be well supported ahead of 0.6700. | ||
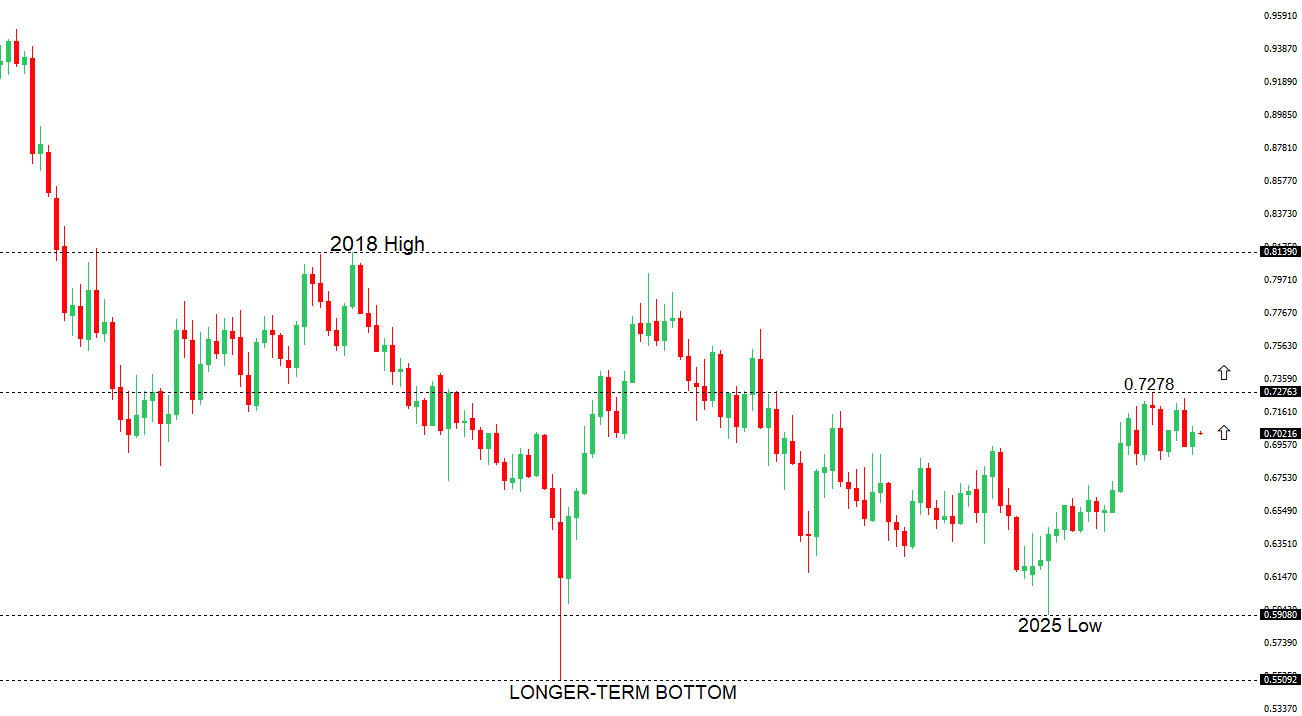 | ||
| R2 0.7000 - Psychological - Medium R1 0.6943 - 6 November high - Medium S1 0.6865 - 30 June low - Medium S2 0.6833 - 3 March low - Strong | ||
| AUDUSD: fundamental overview | ||
| The Australian dollar remains under pressure as markets pare back expectations for further RBA tightening. The central bank raised rates this week, but a split vote and softer guidance opened the door to a December pause, even as Deputy Governor Andrew Hauser stressed that inflation remains elevated. A firmer US dollar has added to the pressure on AUDUSD as investors turn cautious ahead of US payrolls, though lower Treasury yields and hopes for diplomatic progress with Iran have tempered the greenback’s rebound. | ||
| Suggested reading | ||
| Markets Build Trust, Not Just Wealth, L. Tantibanchachai, Brookings (November 5, 2026) Bill Gates on the risks and rewards of AI, M. Murgia, Financial Times (November 4, 2026) | ||