


 | ||
| 12th November 2026 | view in browser | ||
| Dollar keeps its bid as AI rebound meets boardroom test | ||
| The dollar is firm and US equity futures are softer heading into Thursday as a hawkish Fed outlook supports the greenback and uncertainty over Nvidia’s leadership weighs on tech. | ||
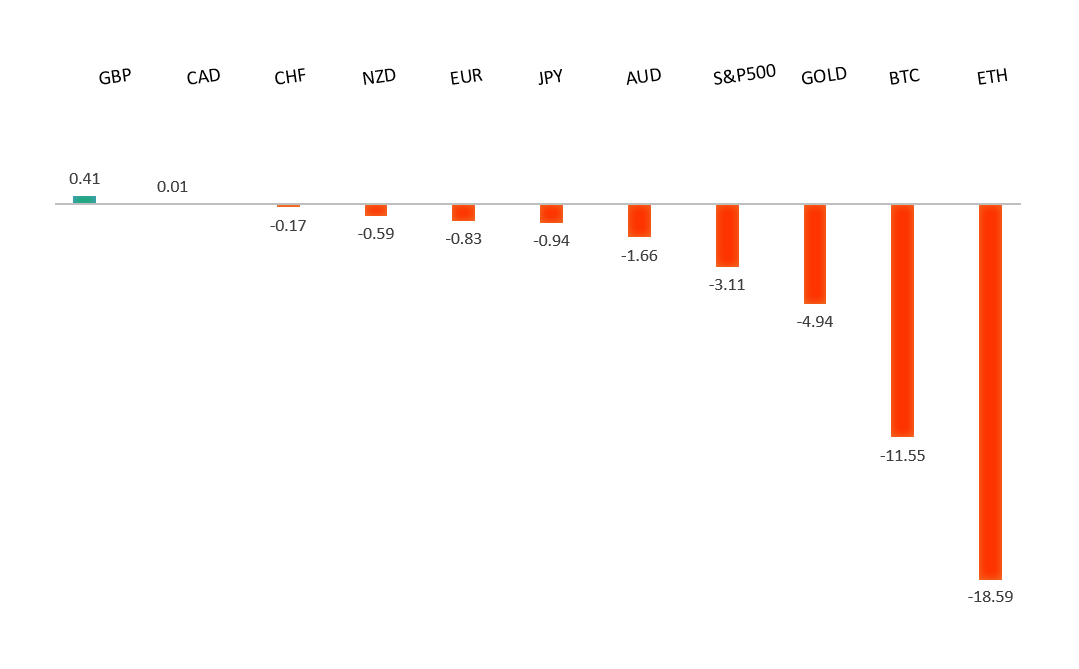
| Performance chart 30day v. USD (%) | ||
 | ||
| Technical & fundamental highlights | ||
| EURUSD: technical overview | ||
| The Euro continues to show signs of wanting to carve out a major bottom after trading down to a 20-year low in 2022. Setbacks should be exceptionally well supported above 1.1000 on a weekly close basis ahead of the next major upside extension back above 1.2000. | ||
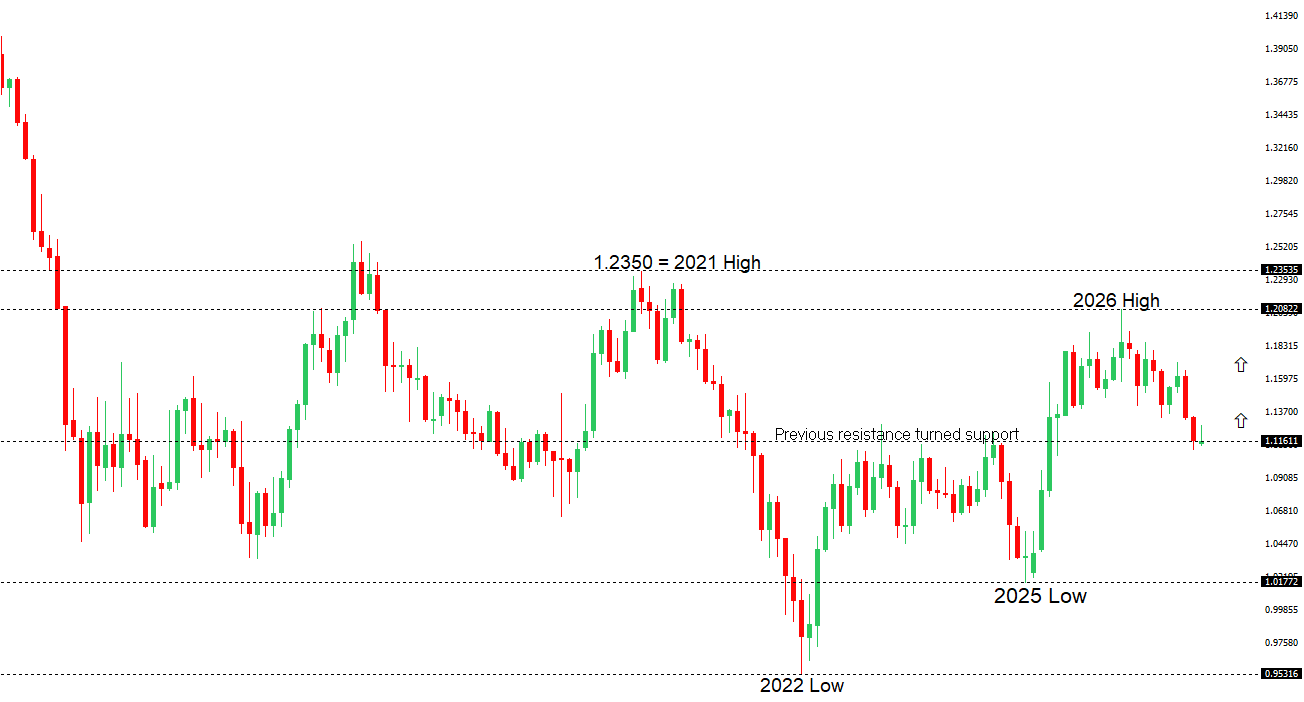 | ||
| R2 1.1274 - 4 November high - Strong R1 1.1171 - 11 November high - Medium S1 1.1066 - 12 November/2026 low - Medium S2 1.1000 - Psychological - Strong | ||
| EURUSD: fundamental overview | ||
| The euro slipped against the dollar early Thursday, extending it run of fresh yearly lows, as a hotter-than-expected U.S. inflation report raised the odds of a larger Fed rate hike in December. Fed Governor Christopher Waller said he favors a quarter-point increase and could back a half-point move if inflation comes in hotter than expected. A December ECB hike also remains in play, though concerns about eurozone growth could limit the scope for further tightening. ECB Chief Economist Philip Lane said the policy outlook hinges on how much the earlier surge in energy costs feeds through to wages and broader prices, even as energy prices ease. Friday’s U.S. producer price report is the next test of whether markets have room to price in a more aggressive Fed move. | ||
| GBPUSD: technical overview | ||
| The Pound remains exceptionally well supported on dips into the 1.3000 area, with the price largely consolidating above the psychological barrier and previous resistance turned support in the form of the 2023 high. Look for the market to continue be well supported on dips ahead of the next major upside extension through the yearly high at 1.3870 and towards a retest of the 2018 high at 1.4377 further up. Only a monthly close below 1.3000 negates. | ||
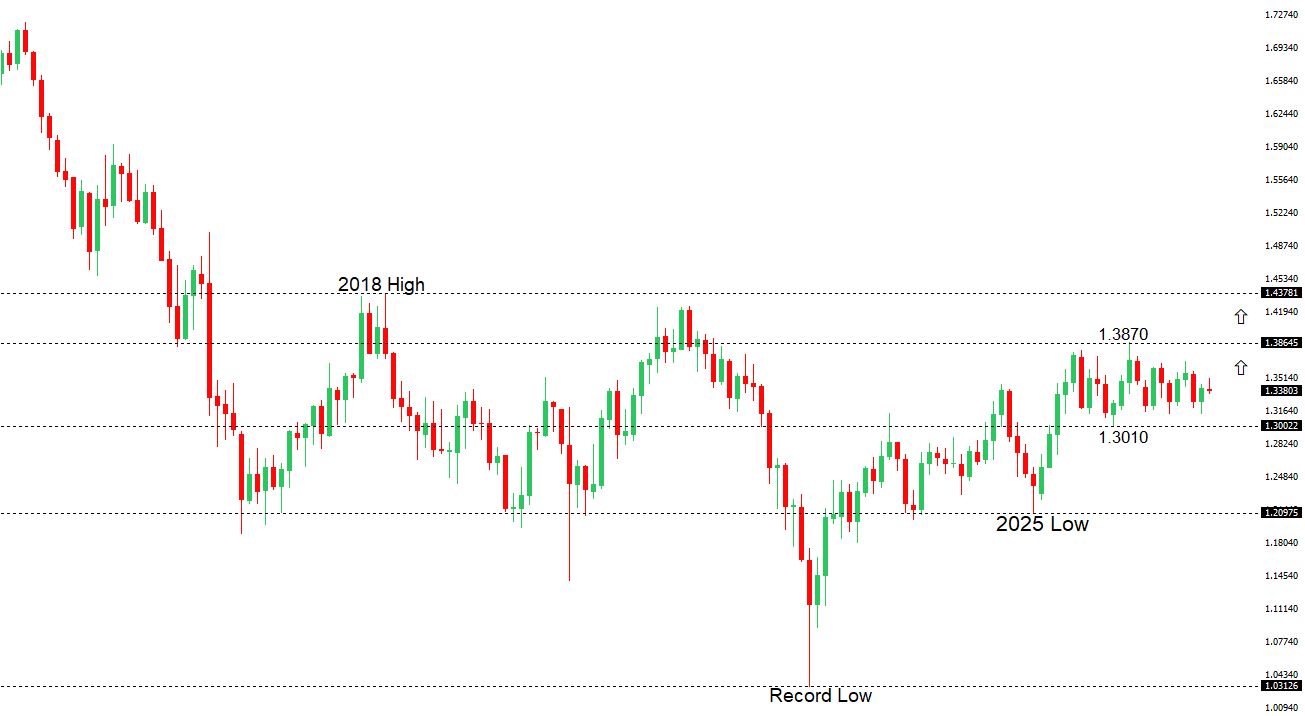 | ||
| R2 1.3419 - 22 October high - Medium R1 1.3356 - 11 November high - Medium S1 1.3250 - 12 November low - Medium S2 1.3137 - 14 October/2026 low - Strong | ||
| GBPUSD: fundamental overview | ||
| Sterling fell to a four-week low against the dollar as hotter-than-expected US inflation and hawkish Fed commentary continue to weigh and lead markets to price in a greater chance of a 50-basis-point rate hike in December. Renewed demand for the dollar as a safe haven amid Middle East tensions added to the pressure on GBPUSD. The Bank of England’s hawkish stance has offered sterling some support, with the monthly and quarterly UK GDP releases now in focus for what they could mean for the UK rate outlook. | ||
| USDJPY: technical overview | ||
| The recent breakdown below 155.00 suggests the market could be on the verge of a bigger structural shift, with the possibility for an end to a longer-term uptrend and the start to a period of persistent weakness. Critical support now comes in the form of the 2026 low from January at 151.97, with a drop below to strengthen the bearish outlook and open the door for a major downside extension targeting the 2024 low at 139.58. The market would need to get back above 160.00 to take the immediate pressure off the downside. | ||
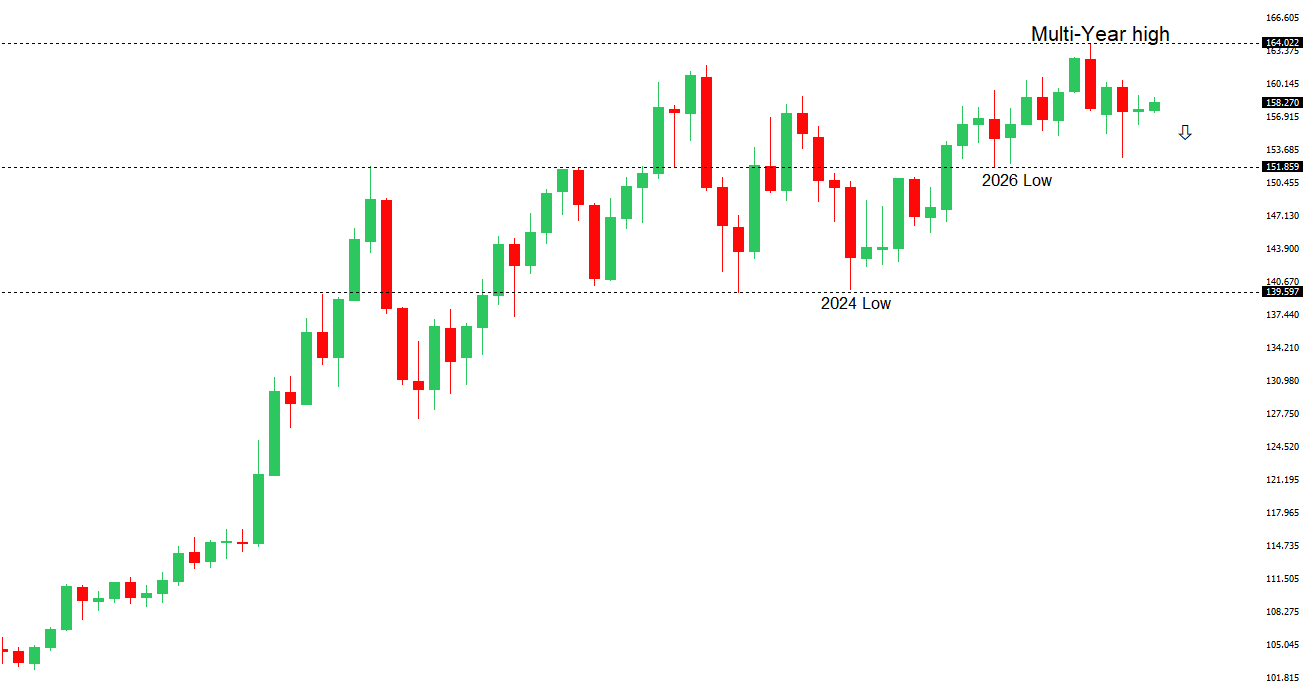 | ||
| R2 160.00 - Psychological - Strong R1 159.94 - 12 November high - Medium S1 158.66 - 11 November low - Medium S2 156.96 - 30 October low - Strong | ||
| USDJPY: fundamental overview | ||
| The yen outperformed is holding up slightly better than its major peers in the new day after stronger-than-expected Japanese producer inflation reinforced expectations for further Bank of Japan rate hikes. Producer prices rose 0.7% in October, more than double the 0.3% consensus, while annual growth accelerated to 7.1% from 6.8%. The data has helped pull USDJPY back into the mid-159 range, though the pair has held close to its recent highs as the US dollar draws support from hawkish Fed commentary. Markets have fully priced in a December Fed hike, and Governor Christopher Waller has raised the possibility of a 50-basis-point move, limiting the yen’s gains against the dollar. | ||
| AUDUSD: technical overview | ||
| There are signs of the formation of a longer-term base with the market recovering out from a meaningful longer-term support zone. The latest monthly close back above 0.7000 takes the big picture pressure off the downside and strengthens the case for a bottom, with the focus now on a push towards 0.8000. Setbacks should now be well supported ahead of 0.6700. | ||
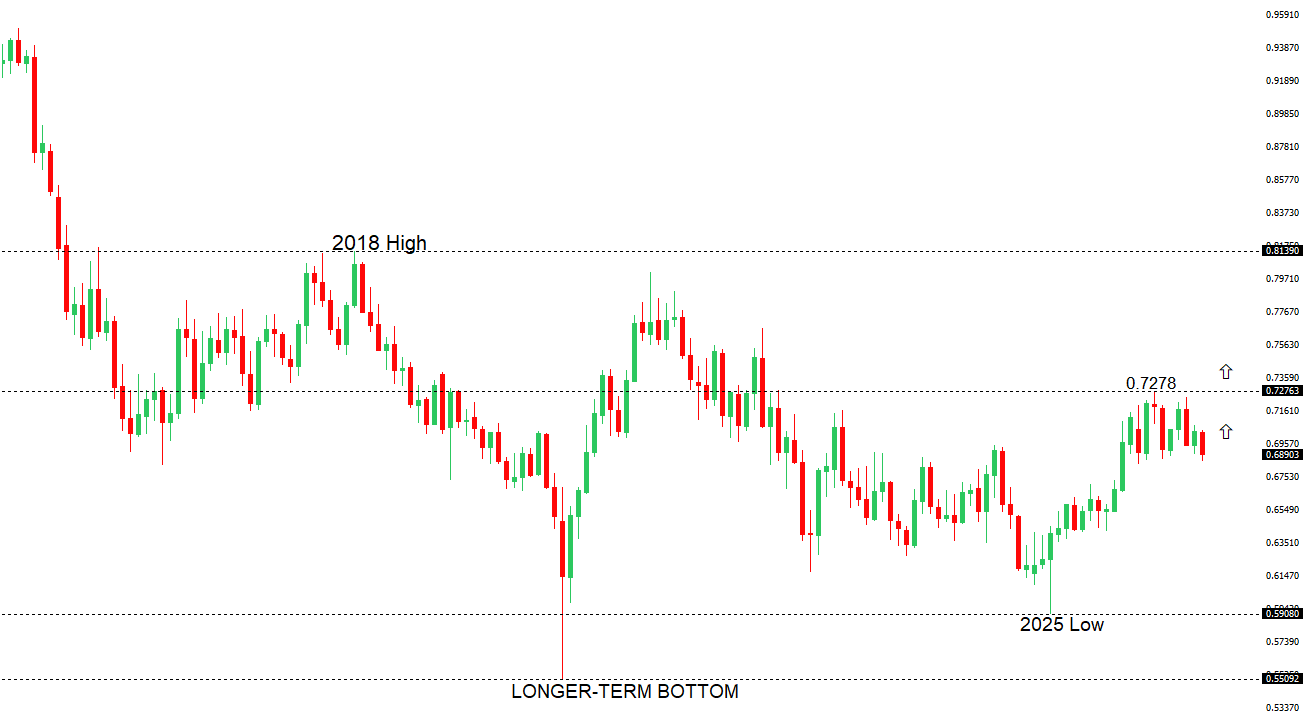 | ||
| R2 0.7000 - Psychological - Medium R1 0.6943 - 6 November high - Medium S1 0.6833 - 3 March low - Strong S2 0.6800 - Figure - Medium | ||
| AUDUSD: fundamental overview | ||
| The Australian dollar fell for a third straight session, with AUDUSD trading near a 10-month low as hotter-than-expected US inflation and hawkish Fed commentary lifted the US dollar. Fed Governor Christopher Waller signaled support for a quarter-point hike in December and left the door open to a half-point move if inflation worsens. In Australia, consumer inflation expectations held at 5.3% in November, the highest since June, while September headline inflation accelerated to 4.3%, well above the RBA’s 2–3% target. Even with those price pressures, markets increasingly expect the RBA to hold rates steady, leaving the Australian dollar under pressure as traders price in further US tightening. | ||
| Suggested reading | ||
| The Gamble of Your Life, N. Maggiulli, Of Dollars and Data (November 10, 2026) 5 Reasons I’m Still Bullish After the Midterm Selloff, L. Navellier, InvestorPlace (November 10, 2026) | ||