


 | ||
| 11th November 2026 | view in browser | ||
| Chips rebound as Fed debate moves past December | ||
| US equity futures are firmer into Wednesday as a rebound in tech offsets some of the pressure from hotter US inflation, while renewed threats to Gulf oil supplies keep crude bid and the dollar supported. | ||
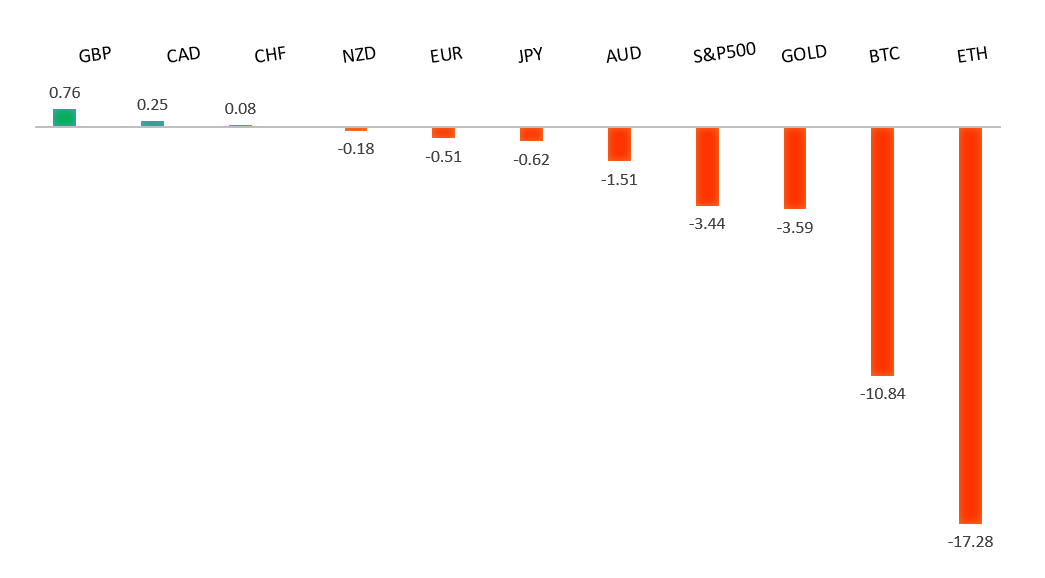
| Performance chart 30day v. USD (%) | ||
 | ||
| Technical & fundamental highlights | ||
| EURUSD: technical overview | ||
| The Euro continues to show signs of wanting to carve out a major bottom after trading down to a 20-year low in 2022. Setbacks should be exceptionally well supported above 1.1000 on a weekly close basis ahead of the next major upside extension back above 1.2000. | ||
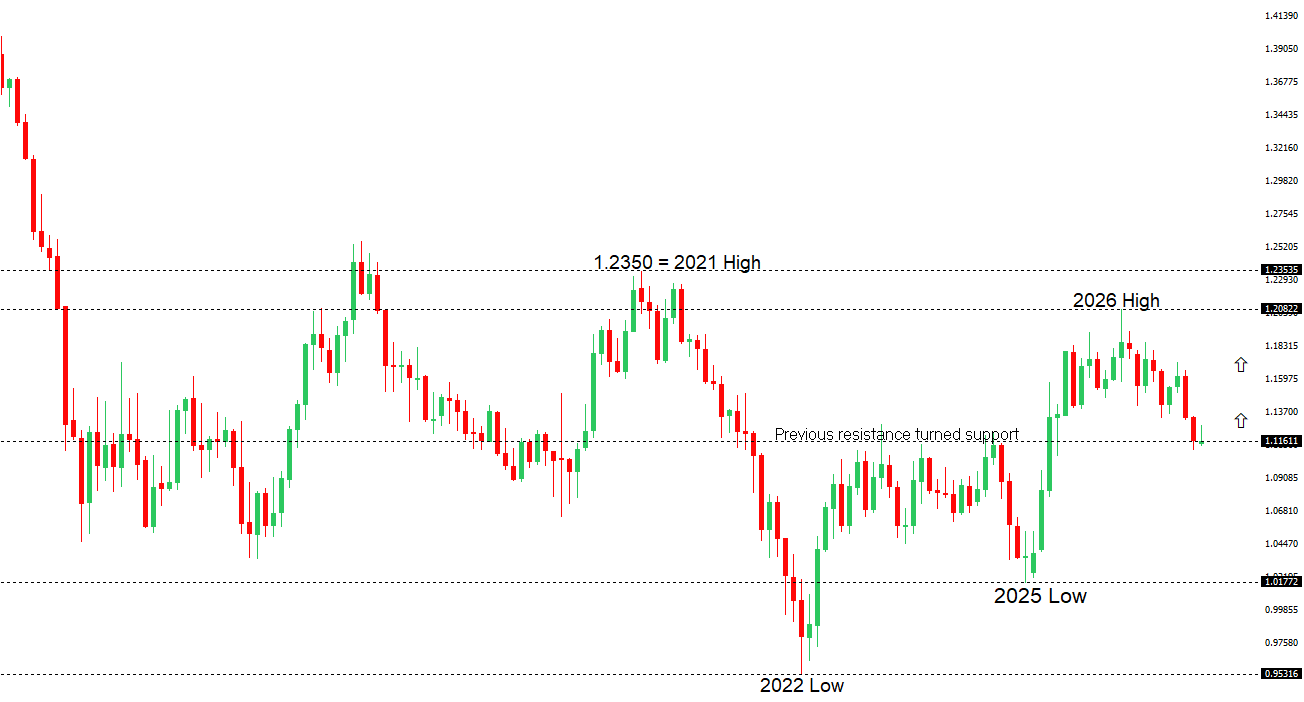 | ||
| R2 1.1337 - 1 October high - Medium R1 1.1274 - 4 November high - Medium S1 1.1131 - 6 November low - Medium S2 1.1104 - 29 October/2026 low - Strong | ||
| EURUSD: fundamental overview | ||
| The euro is struggling to recover from Tuesday’s selloff after both headline and core US inflation came in hotter than expected, lifting the dollar and reinforcing expectations for a December Fed rate hike. Hawkish remarks from Fed officials added to the pressure, with Governor Christopher Waller raising the possibility of a half-point move and Anna Paulson and Lorie Logan signaling a willingness to tighten more aggressively if needed. Hopes for a diplomatic breakthrough between the US and Iran have tempered safe-haven demand for the dollar, helping steady EURUSD as traders turn to Germany’s final inflation reading and remarks from ECB President Christine Lagarde and Executive Board member Piero Cipollone. | ||
| GBPUSD: technical overview | ||
| The Pound remains exceptionally well supported on dips into the 1.3000 area, with the price largely consolidating above the psychological barrier and previous resistance turned support in the form of the 2023 high. Look for the market to continue be well supported on dips ahead of the next major upside extension through the yearly high at 1.3870 and towards a retest of the 2018 high at 1.4377 further up. Only a monthly close below 1.3000 negates. | ||
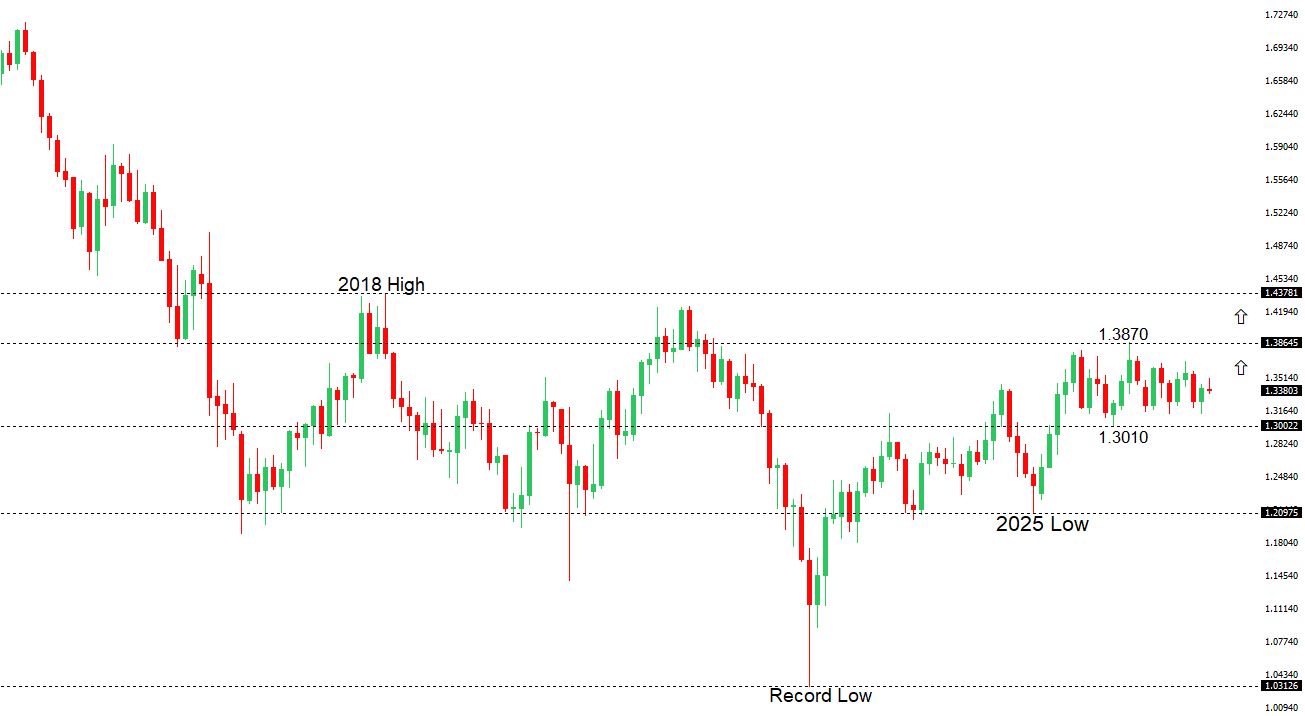 | ||
| R2 1.3568 - 9 September high - Medium R1 1.3504 - 4 November high - Medium S1 1.3312 - 10 November low - Medium S2 1.3272 - 28 October low - Strong | ||
| GBPUSD: fundamental overview | ||
| Sterling has found some buying interest after Tuesday’s selloff, but a firmer US dollar is keeping the rebound in check. Hotter-than-expected US inflation reinforced expectations for a December Fed hike and led traders to price in some chance of a half-point move. The Bank of England’s hawkish stance continues to lend the pound some support, while hopes for progress in US–Iran diplomacy have tempered safe-haven demand for the dollar. | ||
| USDJPY: technical overview | ||
| The recent breakdown below 155.00 suggests the market could be on the verge of a bigger structural shift, with the possibility for an end to a longer-term uptrend and the start to a period of persistent weakness. Critical support now comes in the form of the 2026 low from January at 151.97, with a drop below to strengthen the bearish outlook and open the door for a major downside extension targeting the 2024 low at 139.58. The market would need to get back above 160.00 to take the immediate pressure off the downside. | ||
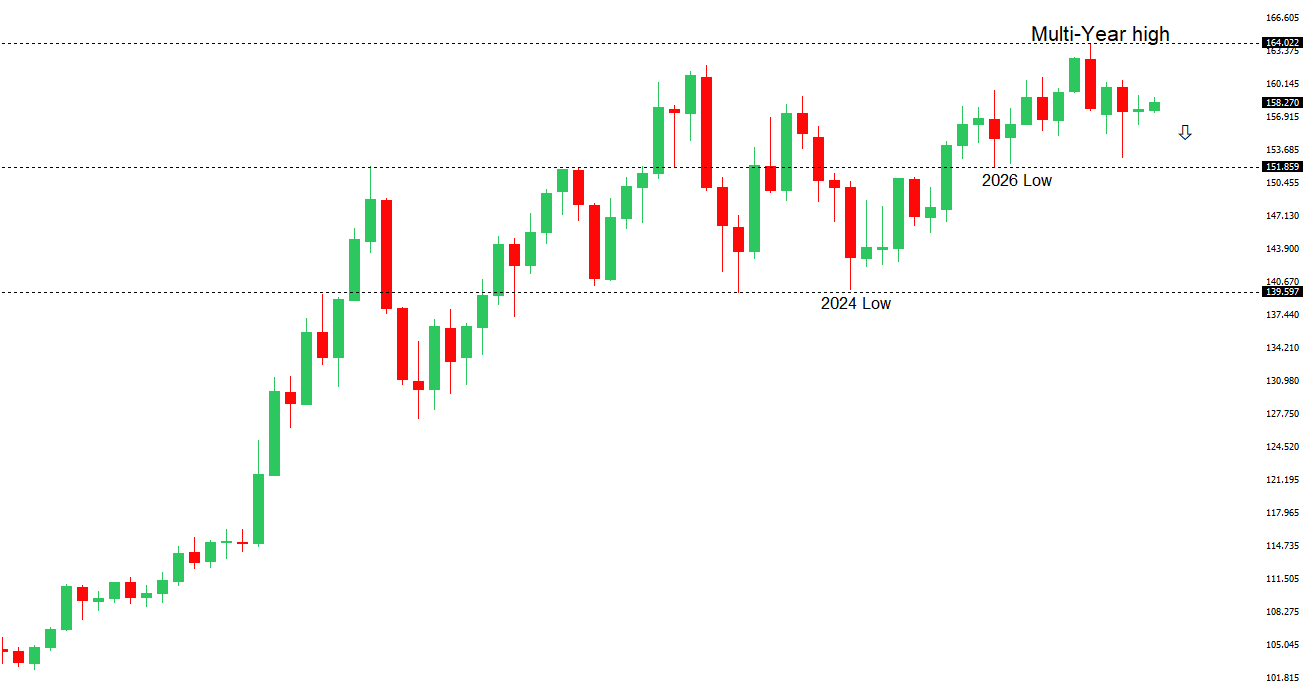 | ||
| R2 159.04 - 24 September high - Strong R1 158.96 - 11 November high - Medium S1 156.96 - 30 October low - Medium S2 156.07 - 23 October low - Strong | ||
| USDJPY: fundamental overview | ||
| The yen remains under pressure as firmer-than-expected US headline and core inflation reinforced expectations for a December Fed rate hike, with markets now pricing in roughly a 90% chance. Fed’s Goolsbee added to the hawkish tone by flagging persistent services inflation, helping keep the dollar bid even as easing US-Iran tensions tempered safe-haven demand. In Japan, the BoJ’s October summary of opinions showed some policymakers favoring faster rate hikes as underlying inflation reached the bank’s 2% target, while others urged caution given weak household spending and uncertainty over the durability of AI-related demand. That leaves a December BoJ hike in play, while a modest narrowing in the US-Japan 10-year yield gap has helped limit the yen’s losses. | ||
| AUDUSD: technical overview | ||
| There are signs of the formation of a longer-term base with the market recovering out from a meaningful longer-term support zone. The latest monthly close back above 0.7000 takes the big picture pressure off the downside and strengthens the case for a bottom, with the focus now on a push towards 0.8000. Setbacks should now be well supported ahead of 0.6700. | ||
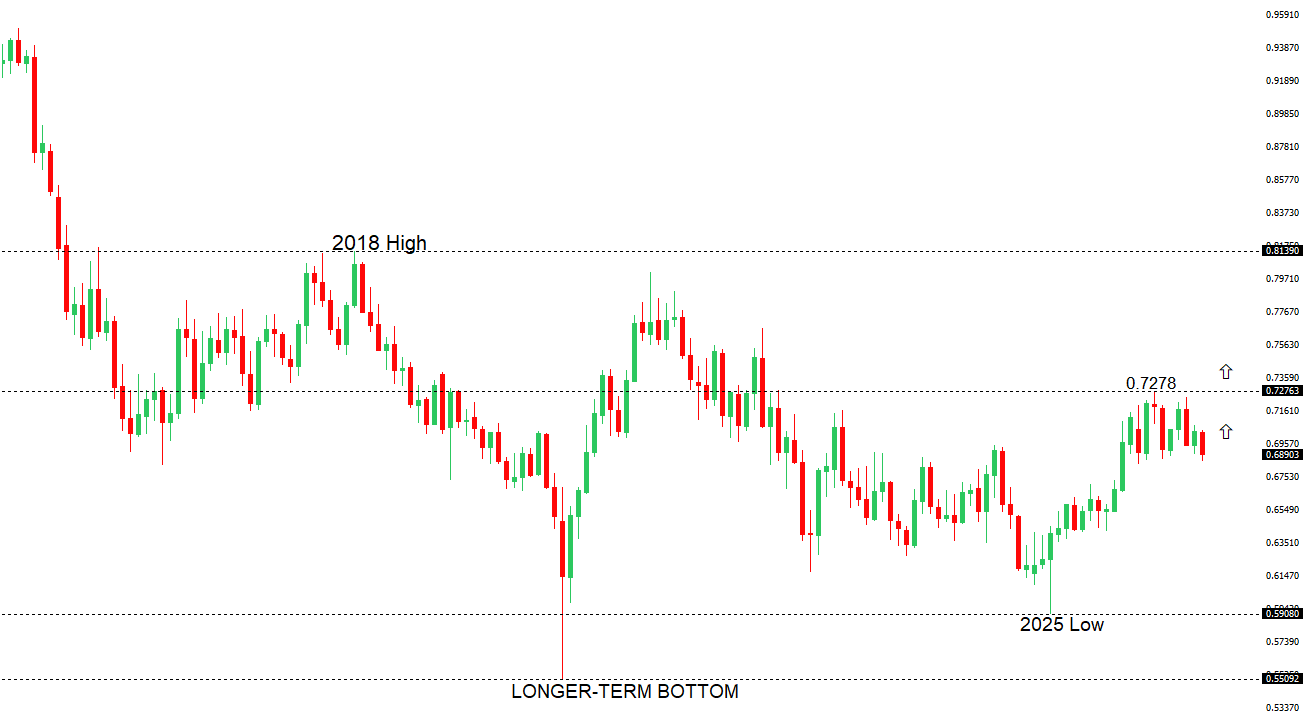 | ||
| R2 0.7000 - Psychological - Medium R1 0.6943 - 6 November high - Medium S1 0.6844 - 10 November low - Medium S2 0.6833 - 3 March low - Strong | ||
| AUDUSD: fundamental overview | ||
| The Australian dollar edged higher in Wednesday’s Asian trade after slipping below 0.6900 on Tuesday, but hotter-than-expected US inflation continues to support the greenback. Core CPI rose 0.3% on the month, above expectations and at the level Fed Governor Christopher Waller said would lead him to favor a 50-basis-point hike. A quarter-point increase remains the market’s base case for December, though traders are assigning some risk to a larger move. At home, Australian consumer confidence fell to a four-year low in November, suggesting the RBA’s rate hikes are weighing on households and leaving the Aussie with little domestic support. | ||
| Suggested reading | ||
| Inside Ken Griffin’s Miami, J. Shah, Financial Times (November 11, 2026) More Questions Than Answers, J. Calhoun, Alhambra Investments (November 8, 2026) | ||