


Next 24 hours: A little upbeat but mostly subdued
Today’s report: An interesting inflection point
Markets have been confined to consolidation this week and there just hasn’t been any fresh catalysts to jolt prices one way or the other. At the moment, a lot of the talk in the currency markets is around the potential policy divergence amongst central banks, one that we haven’t seen for years.
Wake-up call
- ECB
- hawkish BOE
- Yield differentials
- rate hikes
- trade balance
- RBNZ pricing
- Stocks vulnerable
- Dealers report
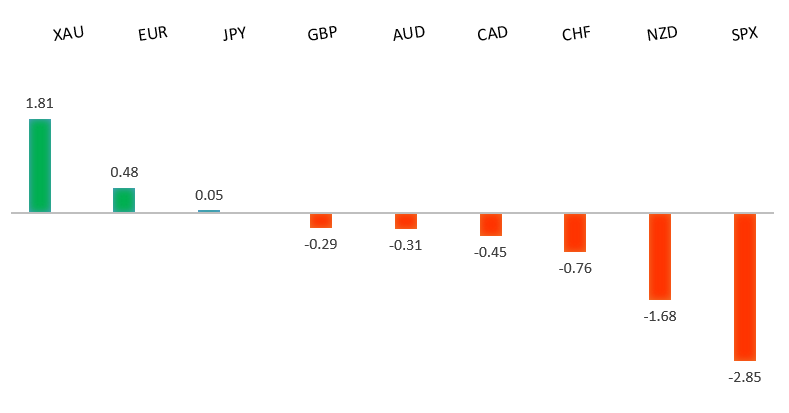
Peformance chart: 30 Day Performance vs. US dollar (%)
Suggested reading
- Populism May Be Losing Its Influence Over Markets, A. Brown, Bloomberg (February 9, 2022)
- How Hertz bounced back from bankruptcy, Financial Times (February 9, 2022)
Chart talk: Technical & fundamental highlights
Choose pair:
EURUSD – technical overview
Setbacks have been well supported below 1.1200, with the market sharply reversing course and pushing back towards the yearly high. A clear break back above 1.1500 will suggest the market could be getting ready to turn back up. Inability to sustain above 1.1500 will keep the pressure on the downside.EURUSD – fundamental overview
The Euro continues to ease off as ECB officials push back on rate hike expectations post last week's hawkish ECB decision. Key standouts on today’s calendar include German trade, US wholesale inventories, and speeches from BOE Pill, BoC Macklem, and Fed Mester.EURUSD - Technical charts in detail
GBPUSD – technical overview
The market is in a correction phase in the aftermath of the run to fresh multi-month highs in 2021. At this stage, additional setbacks should be limited to the 1.3000 area ahead of the next major upside extension towards a retest and break of critical resistance in the form of the 2018 high. Back above 1.3835 takes pressure off the downside.GBPUSD – fundamental overview
We continue to see signs of relative outperformance in the Pound as the market prices in yield differentials that slant decidedly in favour of the UK currency on account of the more hawkish leaning BOE policy outlook. Key standouts on today’s calendar include German trade, US wholesale inventories, and speeches from BOE Pill, BoC Macklem, and Fed Mester.USDJPY – technical overview
The longer-term trend is bearish despite the recent run higher. Look for additional upside to be limited, with scope for a topside failure and bearish resumption back down towards the 100.00 area. It would take a clear break back above 117.00 to negate the outlook.USDJPY – fundamental overview
Soft Japanese data and yield differentials that continue to widen in favour of the Buck have resulted in Yen weakness in recent sessions. Key standouts on today’s calendar include German trade, US wholesale inventories, and speeches from BOE Pill, BoC Macklem, and Fed Mester.AUDUSD – technical overview
The Australian Dollar has been in the process of a healthy correction following the impressive run towards a retest of the 2018 high in 2021. At this stage, the correction is starting to look stretched and setbacks should be well supported above 0.7000 on a weekly close basis. A weekly close below 0.7000 will force a bearish shift.AUDUSD – fundamental overview
The Australian Dollar has been holding up well of late, getting help from a recent impressive Aussie retail sales print, news Australia will be reopening its borders for international travel, and a rates market pricing hikes in June and August. Key standouts on today’s calendar include German trade, US wholesale inventories, and speeches from BOE Pill, BoC Macklem, and Fed Mester.USDCAD – technical overview
Finally signs of a major bottom in the works after a severe decline from the 2020 high. A recent weekly close back above 1.2500 encourages the constructive outlook and opens the door for a push back towards next critical resistance in the 1.3000 area. Any setbacks should be well supported into the 1.2200s.USDCAD – fundamental overview
Discouraging Canada trade data and a pullback in the price of oil have been responsible for recent weakness in the Canadian Dollar. Key standouts on today’s calendar include German trade, US wholesale inventories, and speeches from BOE Pill, BoC Macklem, and Fed Mester.NZDUSD – technical overview
Setbacks have intensified in recent weeks with the market trading down to fresh multi-month lows. A recent breakdown below the 0.6700 area opens the door for a drop towards 0.6500 in the sessions ahead.NZDUSD – fundamental overview
The New Zealand Dollar finally found some demand after getting slammed to multi-month lows the other week, with the currency propped up on the rebound in stocks, hawkish expectations from the RBNZ in 2022, improved Kiwi economic data and a better COVID outlook. Key standouts on today’s calendar include German trade, US wholesale inventories, and speeches from BOE Pill, BoC Macklem, and Fed Mester.US SPX 500 – technical overview
Longer-term technical studies are in the process of unwinding from extended readings off record highs. The latest breakdown below 4,272 opens the door for the next major downside extension towards 3,500. Back above 4,612 will be required at a minimum to take the immediate pressure off the downside.US SPX 500 – fundamental overview
With so little room for additional central bank accommodation, given an already depressed interest rate environment, the prospect for sustainable runs to the topside on easy money policy incentives and government stimulus, should no longer be as enticing to investors. Meanwhile, ongoing worry associated with coronavirus fallout and risk of rising inflation should weigh more heavily on investor sentiment in Q1 2022.GOLD (SPOT) – technical overview
The 2019 breakout above the 2016 high at 1375 was a significant development, opening the door for fresh record highs and an acceleration beyond the next major psychological barrier at 2000. Setbacks should now be well supported above 1600.GOLD (SPOT) – fundamental overview
The yellow metal continues to be well supported on dips with solid demand from medium and longer-term accounts. These players are more concerned about exhausted monetary policy, extended global equities, and coronavirus fallout. All of this should keep the commodity well supported, with many market participants also fleeing to the hard asset as the grand dichotomy of record high equities and record low yields comes to an unnerving climax.